Risk Owner Dashboards
This article details the Risk owner dashboards, specifically designed for roles such as IT Managers, DevOps Engineers, or System Administrators who are responsible for managing infrastructure teams and overseeing potential risks. The dashboard provides a comprehensive overview of all assets, findings, requests, and tickets under their scope, focusing on tracking open issues and those due imminently. The dashboards are composed of three main dashboard — Act, Monitor, and Comply - each providing insights and tools to enhance risk management and team efficiency.
To access the Risk owner dashboards, navigate to Dashboards, expand the left-hand side navigation menu, and then click one of the dashboards under the Risk owner dropdown.
To see any data in the risk owner dashboards, users must be associated with the finding or asset through the risk owner cluster and have either the Risk analyst or Risk owner role assigned to them. Access granted with the informed user cluster does not qualify for inclusion in these dashboards. Additionally, the data in these dashboards are updated following each successful completion of the data orchestration process.
Act dashboard
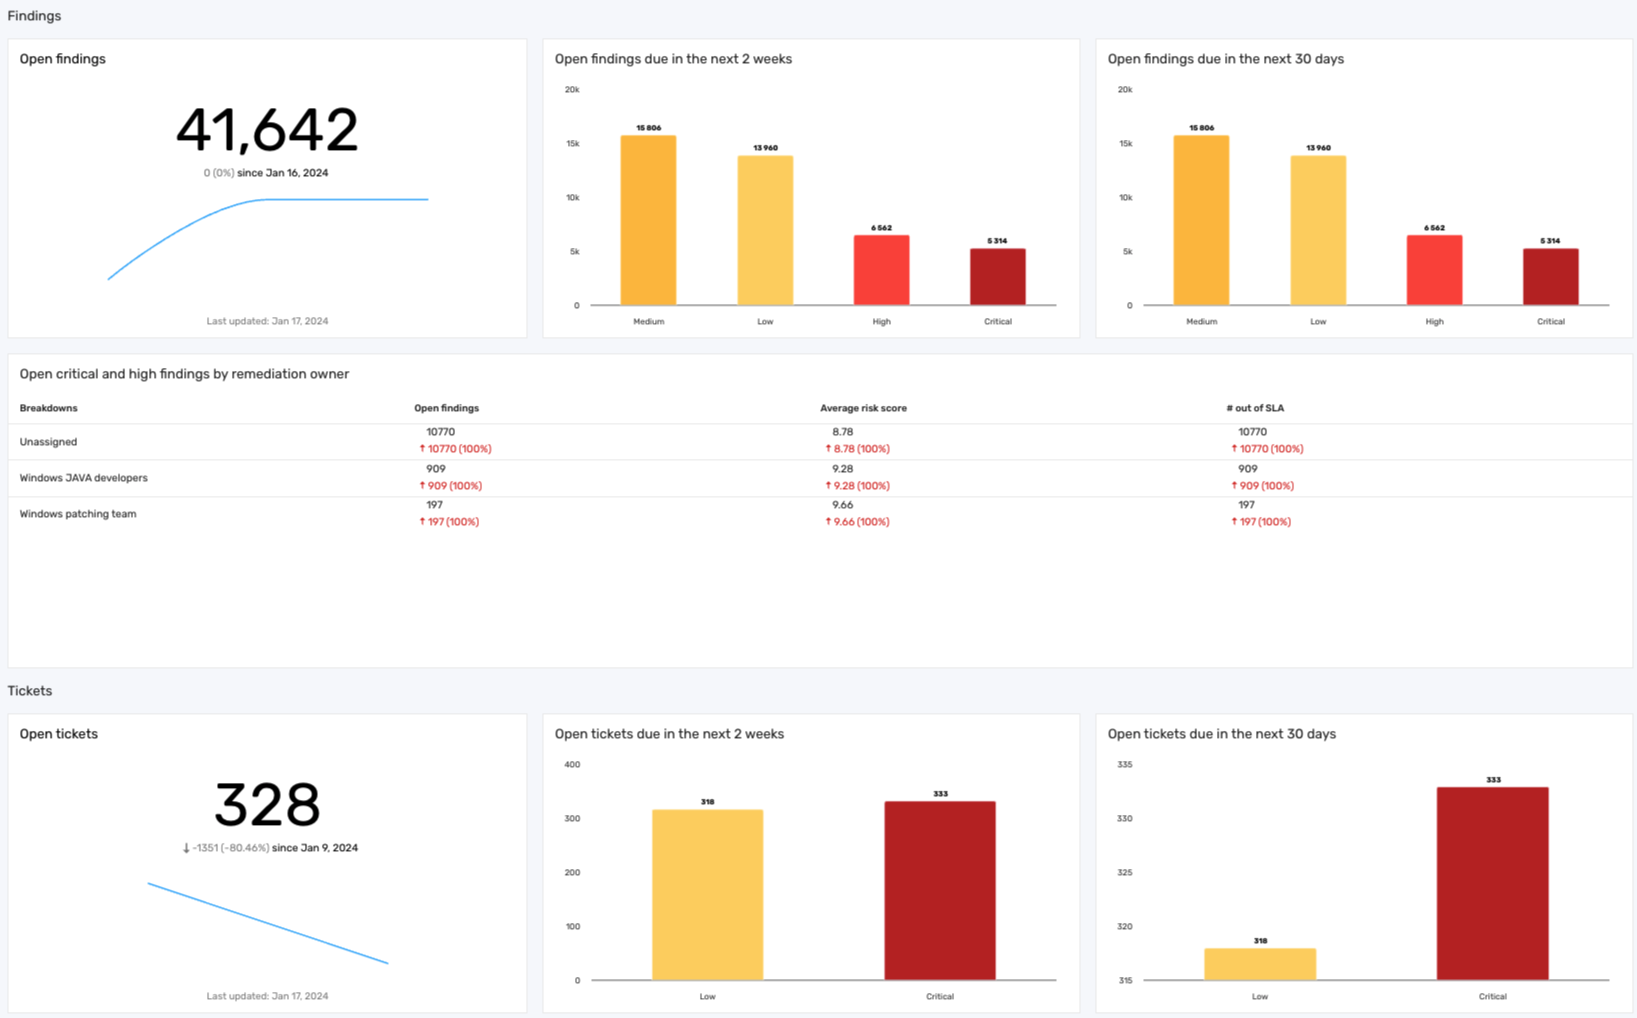
The Act dashboard highlights the most critical items that require immediate action. This dashboard provides a detailed view of open and new findings, with an emphasis on those that are overdue or approaching their service-level agreement (SLA) deadlines. It also includes requests and tickets related to the findings overseen by the risk owner, offering a clear perspective on areas requiring attention. The dashboard aims to assist risk owners in efficiently managing and reducing risks within their assigned environments and ensuring team adherence to SLA requirements. The following screenshot illustrates what your Act dashboard may look like:
Key features
The Act dashboard includes the following sections:
Findings: This section of the Act dashboard organizes findings under the risk owner's scope. It provides a comprehensive view of open findings, highlighting those that require immediate action, including findings due within the next 2 weeks and those approaching their SLA deadlines in the upcoming month. This can help risk owners manage and prioritize findings based on their severity and due dates.
The Findings section contains an Open critical and high findings by remediation owner table that displays counts of all critical and high findings that the remediation owners or teams are responsible for addressing:
Table 1: Open critical and high findings by remediation owner
| Column | Description |
|---|---|
| Breakdowns | The specific remediation owner or team responsible for each set of findings. |
| Open findings | The total number of open high and critical findings assigned to each remediation owner or team. |
| Average risk score | The average risk score (on a scale of 0-10) of the findings per remediation owner or team. |
| # out of SLA | The number of high and critical findings that have not been resolved within the specified SLA timeframe. |
Tickets: This section of the Act dashboard organizes tickets within the risk owner's scope, providing a comprehensive overview of open tickets. It highlights tickets requiring immediate attention, including those with upcoming deadlines in the next 2 weeks and the next 30 days, categorized by risk rating. This setup enables risk owners to effectively prioritize and oversee ticket resolution based on severity and due dates.
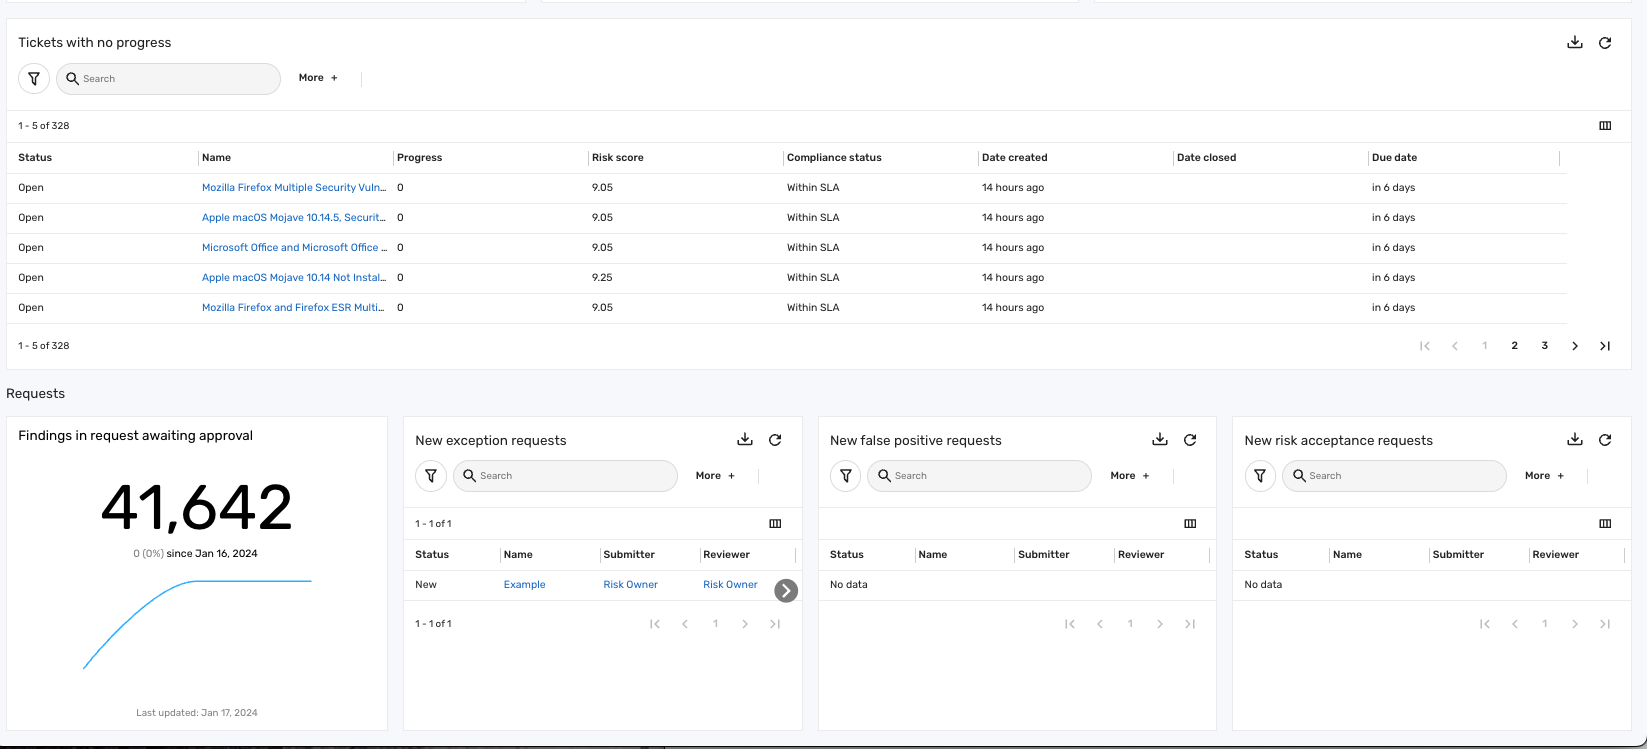
The Tickets section also contains a Tickets with no progress table that displays tickets containing findings with no movement, regardless of when they were created:
Table 2: Tickets with no progress
| Column | Description |
|---|---|
| Status | The current status of the ticket. Statuses include Backlog, Closed, In progress, Open, or To-do. |
| Name | The name of the ticket. |
| Progress | The proportion of findings within the ticket that have been addressed, determining the ticket's progress towards resolution. The number is zero since there is no progress. |
| Risk score | The risk score associated with the ticket. |
| Compliance status | The compliance status of the ticket. Compliance statuses include Met SLA, Out of SLA, or Within SLA. |
| Date created | The date on which the ticket was initially created. |
| Date closed | The date on which the ticket was resolved or closed. |
| Due date | The deadline for the ticket to be addressed or resolved. |
Requests: This section of the Act dashboard provides a unified view of various types of requests within the risk owner's scope, including new exception requests, new false positive requests, and new risk acceptance requests. It highlights the total number of findings in pending approval requests and displays key information such as each request's status, name, submitter, and reviewer. This consolidated view can assist risk owners in managing and overseeing the approval process for all types of requests they are responsible for.
Comply dashboard
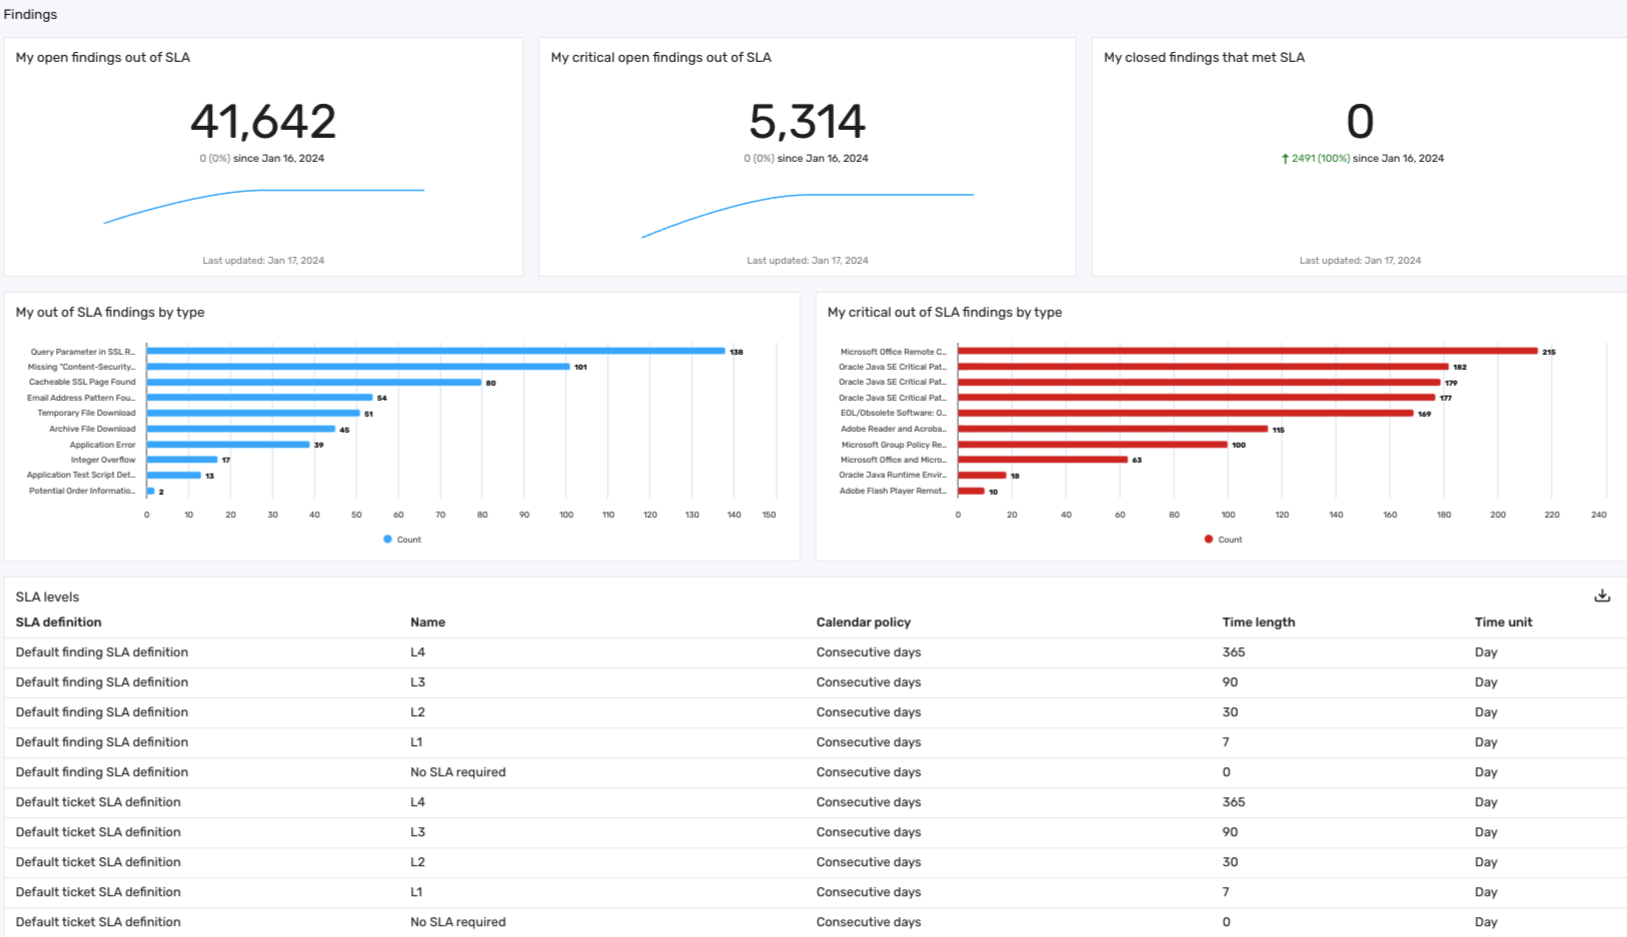
The Comply dashboard provides risk owners with insights into compliance with SLA deadlines and the nature of the findings within their scope. This allows risk owners to gauge the overall risk management effectiveness and identify areas that may need attention. The following screenshot illustrates what your Comply dashboard may look like:
Key features
Key features of this section include:
-
My open findings out of SLA: Highlights all open findings that have exceeded their SLA deadlines, providing risk owners with a clear view of overdue issues.
-
My critical open findings out of SLA: Focuses on critical findings that are out of SLA, allowing risk owners to prioritize the most severe risks needing urgent intervention.
-
My closed findings that met SLA: Showcases findings that were successfully resolved within their SLA timelines, offering insights into areas where the risk management process is effective.
-
My out of SLA findings by type: Categorizes all findings that are out of SLA by their specific type, enabling risk owners to understand the potentially common types of delayed findings.
-
My critical out of SLA findings by type: Categorizes critical findings that are out of SLA by type, helping risk owners prioritize areas that may require immediate action.
This section also includes a table detailing various SLA levels, helping risk owners understand the default SLA definitions and the allotted resolution times for different levels of findings and tickets:
Table 3: SLA levels
| Column | Description |
|---|---|
| SLA definition | The name of the SLA definition. |
| Name | The default service level of the corresponding SLA definition. Levels include No SLA required, L1, L2, L3, or L4, with findings or tickets adhering to L1 being due in 7 days, and L4 findings or tickets due in 365 days. |
| Calendar policy | The days in which the SLA is measured, either Consecutive days or Business days. Business days include Monday through Friday. |
| Time length | The amount of time, in days, before the findings or tickets are considered out of SLA. |
| Time unit | The time unit for the service level. |
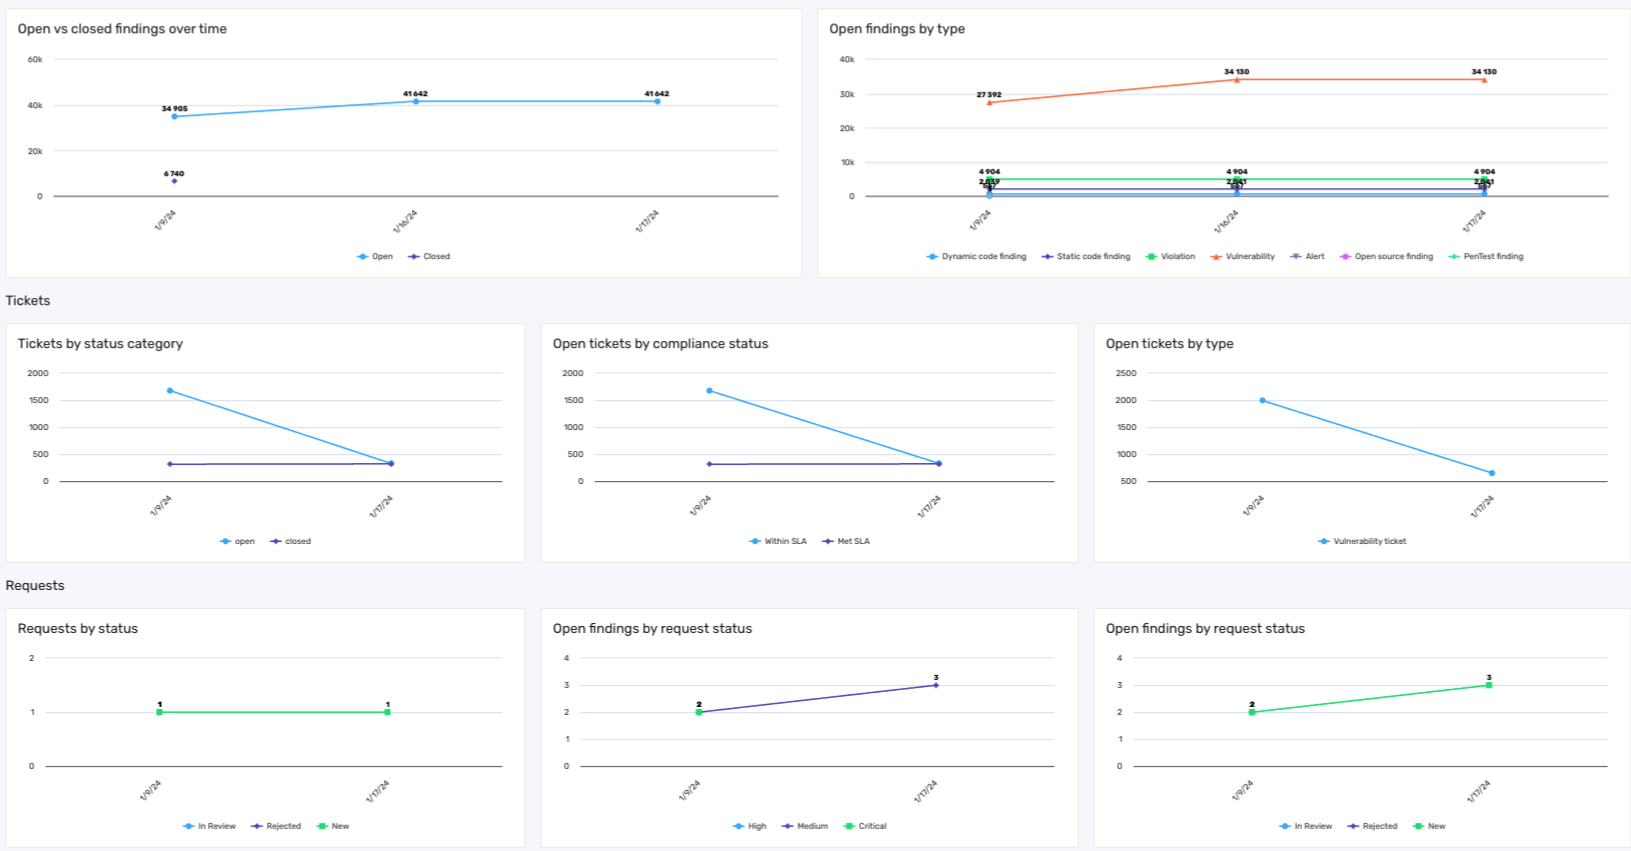
Monitor dashboard
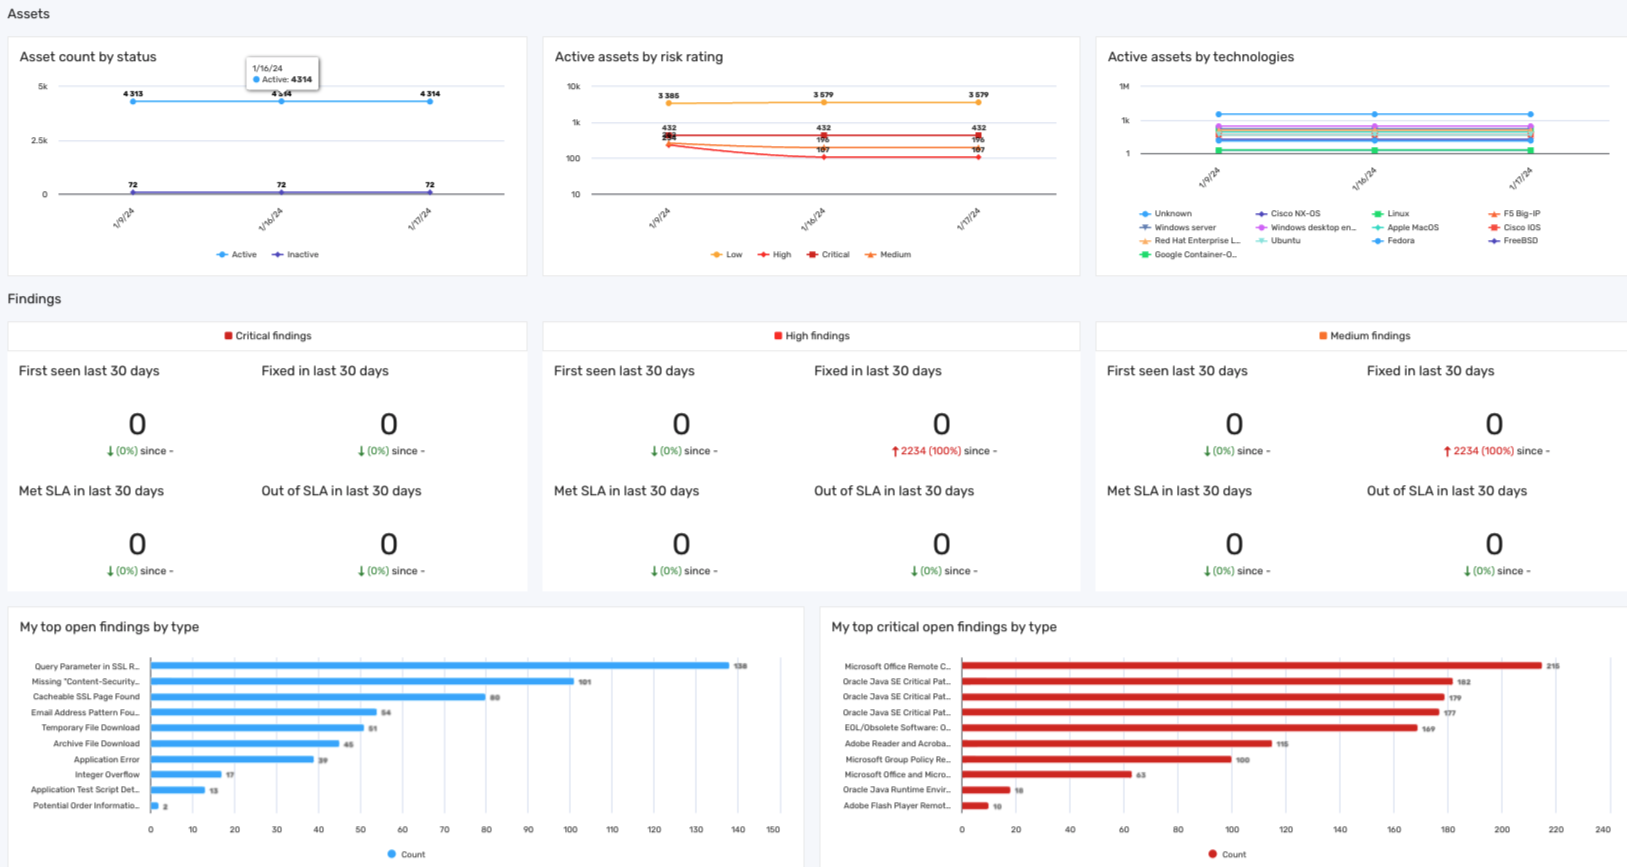
The Monitor dashboard is designed to provide risk owners with insights for overseeing their areas of responsibility. This dashboard offers a comprehensive view of tracking trends and developments in assigned assets, findings, tickets, and requests. The following screenshot illustrates what your Monitor dashboard may look like:
Key features
The Monitor dashboard includes the following sections:
-
Assets: This section of the Monitor dashboard displays the assets overseen by the risk owner, including those without current findings. It provides a count of all assets categorized by their status (active or inactive) and shows active assets segregated by risk rating (low, medium, high, or critical), as well as by technology type, such as laptops, servers, phones, or tablets.
-
Findings: This section categorizes findings under the risk owner's management. It categorizes findings based on severity levels and SLA deadlines, and tracks findings first seen or resolved in the last 30 days. It also presents a comparative view of open and closed findings over time, as well as a breakdown of open findings by their types.
infoThe types of findings are the data models that extend Finding. These types include alerts, dynamic code findings, manual findings, open source findings, pentest findings, static code findings, violations, and vulnerabilities.
-
Tickets: This section of the Monitor dashboard provides a comprehensive view of tickets related to the findings overseen by the risk owner. It includes:
-
Ticket by status category: Displays the current status of tickets, categorizing them as either open or closed, giving a quick snapshot of ongoing versus completed tasks.
-
Open tickets by compliance status: Highlights open tickets associated with findings that the risk owner is responsible for overseeing, highlighting their compliance status, such as Within SLA or Met SLA. This can help risk owners adhere to their organization's established service-level agreements.
-
Open tickets by type: Categorizes ticket counts by types, such as vulnerability tickets, violation tickets, or pentest tickets. This can provide risk owners with insights into the nature of issues being managed.
-
-
Requests: This section of the Monitor dashboard organizes requests related to findings under the risk owner's management and their related findings. Key features of this section include:
-
Requests by status: Tracks requests by their current status over time, helping risk owners identify trends or significant changes in request activities.
-
Open findings by request status: Presents a count of open findings over time that are currently associated with requests, categorized by the status of these requests, such as Approved, Expired, In Review, New, or Rejected. This can help risk owners understand the implications of pending requests on open findings.
-