Report Overview
This article details reports in the Brinqa Platform and how to create or edit reports using Brinqa's flexible and powerful report builder. For a detailed tutorial on how to create a report with multiple sections, see the Build a Custom Report article.
Introduction to reports
Reports in the Brinqa Platform are extremely flexible and powerful due to the graph data model and the use of API calls to retrieve data. It allows the system to dynamically create subsets of data based on any attributes in a data model, provide in-report filtering, and display data on reports more quickly. Reports give you a way to present, visualize, and analyze the cybersecurity data collected from various data sources, such as vulnerability scanners, asset management systems, and threat intelligence feeds. Reports enable you to gain insights into you organization's security posture, track the progress of risk mitigation efforts, and make data-driven decisions to improve your overall cybersecurity posture.
Reports in the Brinqa Platform can be customized and tailored to meet the specific needs of different stakeholders within your organization, such as executives, security managers, or IT teams. Reports can include various charts, graphs, and tables, displaying information such as risk scores, vulnerability trends, or asset inventory.
Here are some common types of reports you can build in the Brinqa Platform:
-
Executive summary: Provide an overview of your organization's cybersecurity posture and highlight key risk metrics.
-
Risk and vulnerability: Offer detailed information on risk scores, vulnerabilities, and remediation status for individual assets or groups of assets.
-
Compliance reports: Help you monitor your organization's compliance with relevant regulatory standards or industry best practices.
-
Trend reports: Track changes in your security posture over time, identifying emerging threats and the effectiveness of remediation efforts.
Navigate to Analytics to view or modify existing reports and create new reports in your Brinqa Platform.
Dashboards are similar to Reports in that they share many of the same elements. You can add to the dashboard any section you add to a report. Think of your dashboards as a centralized view of what you consider the most important pieces of data in the Brinqa Platform. For additional information, see Dashboards overview.
Create a new report
While your Brinqa Platform contains some default reports built in, you can also create your own reports as desired. To create a new report, follow these steps:
-
Navigate to Analytics.
-
Click Create and in the Setup tab, fill in the following information:
-
Header: The header of the report. The header appears at the top of the specific report page.
-
Title: The title of your report. The title is displayed on the report list view.
-
Name: The referenced name of the report for queries and scripts. The system fills in the name as you type the title, removing any spaces or characters that are not allowed. You do not need to edit this field.
-
Description: The description of the report. The description is displayed on the report list view and can be searched using the search bar.
-
-
Click Save. The page reloads and you can now add sections to your report or customize its appearance.
Customize report appearance
After creating a new report, you can modify the appearance of the report. To do so, follow these steps:
-
Navigate to Analytics and choose the report you want to modify.
-
Click Edit, then Customize, and edit the following fields as needed:
-
Width and margin: Customize the width and the four margins of the report. You can also select Fit to width and No margin.
-
Background and border: Customize the report background color, border color, border width, border radius, or enable a border shadow.
-
Sections background and border: Customize the background and borders of the sections on the report.
-
Actions: Enable fullscreen for the report.
-
-
Click Update.
Add inputs
You can add inputs to your report, which enable you to dynamically filter the contents of the entire report. For example, you can create a vulnerability report that initially displays information about all existing vulnerabilities in your Brinqa Platform. Then, you can add an input to only show information on the vulnerabilities found in the last 30 days.
To add different inputs to your report, follow these steps:
-
Navigate to Analytic > Reports.
-
Click the report you want to add or change the input for.
-
Click Edit and then click Inputs
 .
. -
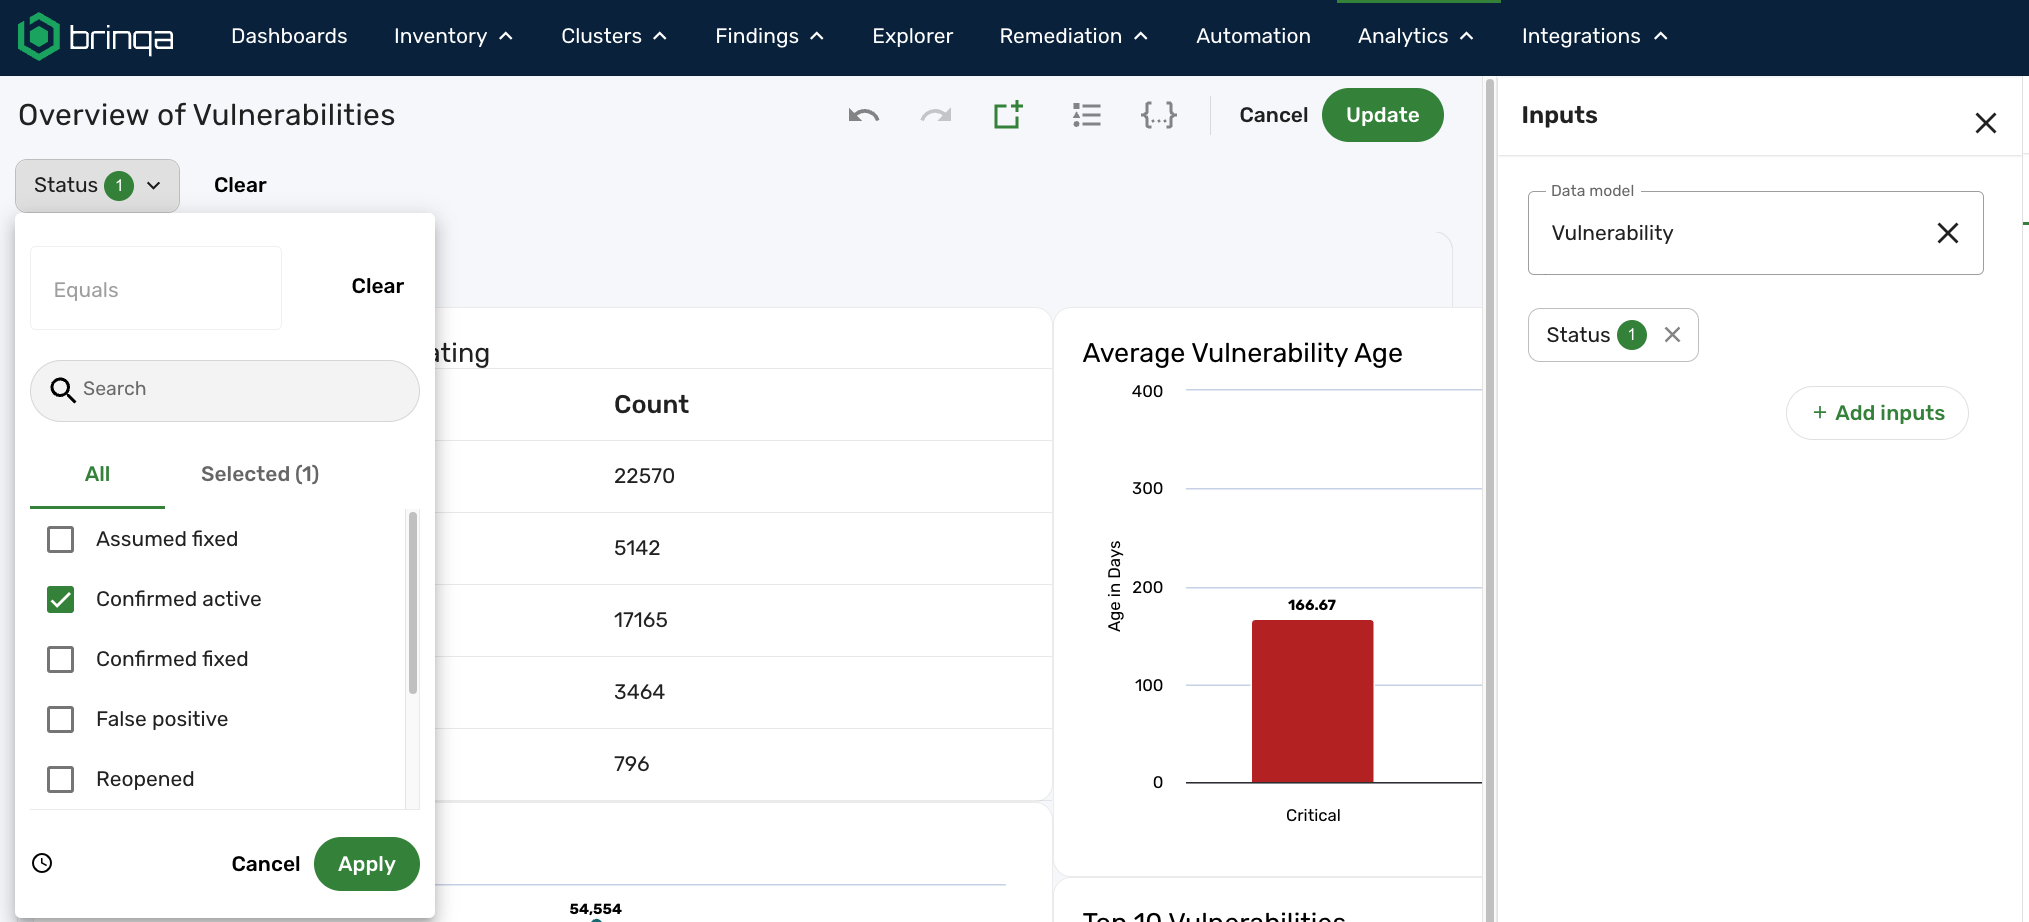
Click the Data model dropdown and choose the same data model as the report to which you are adding the input. For example, if this is a report that targets the Vulnerability data model, choose Vulnerability.
-
Click Add inputs and choose the attribute for the filter. For example, Status.
-
Click Add, and then click Update to save the changes.
The new input displays as filters at the top of the report.
-
Click the attribute to choose the values to filter for. For example, if you selected the Status attribute as an input, click Status and choose the status category you want to filter for. Options differ depending on the data model. For additional information on how the Brinqa Platform determines status, see Status configuration.
-
Click Apply.
You can use this new input like you would a basic search filter to limit the vulnerability data for the report, including all sections on the report. If you do not want this filter to be applied to a certain section, edit the section and select Ignore input filtering.
Repeat these steps for each input you want to add to your report. See step 8 in the Build Your Own Report tutorial to see how an input can change the data presented in your reports.
View source
While editing your report, you can view, edit, or copy the source code for the entire report. Copying the source code of a report can be helpful when you want to create a new report without starting from scratch. To view the source code of a report, follow these steps:
-
Navigate to Analytics > Reports.
-
Click the report you want to view or edit the source for.
-
Click Edit.
-
Click View source
 .
.
Edit or delete a report
You can edit or delete existing reports. Hold the pointer over the report you want to modify and click Edit or Delete.
Share a report
Report sharing was introduced in Brinqa Platform version 11.30. Brinqa strongly recommends upgrading to the latest platform version to take full advantage of the functionality.
Sharing reports in the Brinqa Platform enables you to grant specific users or all users with a certain role the permission to view and interact with certain reports. Additionally, you can allow specific users or roles to edit shared reports.
By default, users with the Configurator or System administrator role can create, edit, delete, and share reports with other users in the Brinqa Platform. Users with the Security administrator or System administrator role can grant additional roles the Read role, Read user, and Share reports access controls so that they have the ability to share reports. For additional information, see Access controls for shared reports.
To share a report, follow these steps:
-
Navigate to Analytics > Reports.
-
Point the cursor over the report you want to share and click Share.
You can also open the report you want to share and then click the Share button
 .
.The Share report dialog appears. You have the following options:
-
Share with Brinqa Users: Click the dropdown and select the user(s) from the list of current Brinqa users to share the report with. It also lists any users that have been granted access to the report.
-
Share with Brinqa Roles: Click the dropdown and select the role(s) to share the report with. It also lists any roles that have been granted access to the report.
-
Grant edit access: (Optional) Click the Can edit toggle to enable user(s) or role(s) to modify the shared report. Users without edit access can only view the report.
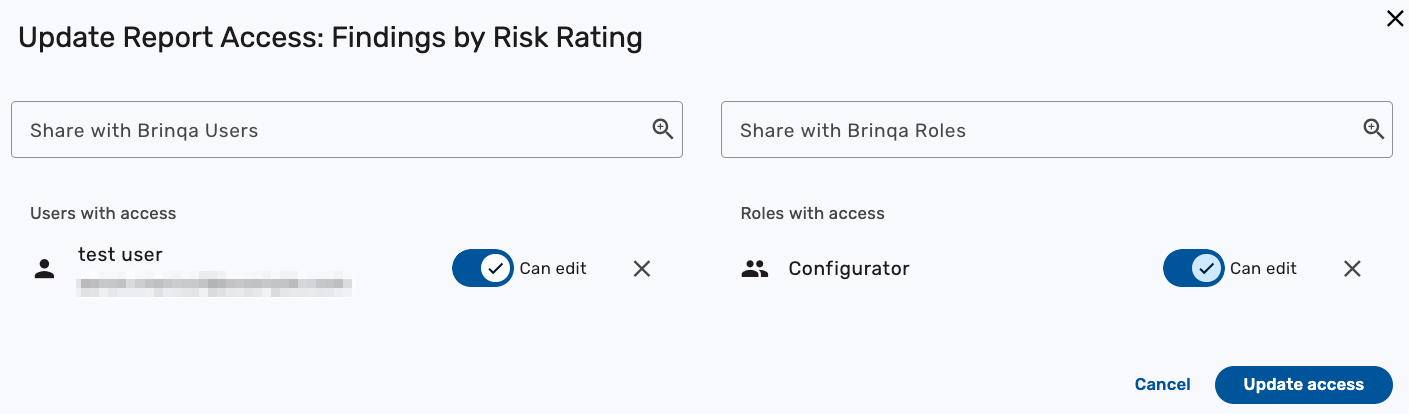
For example, in the screenshot below, a Brinqa user named "test user" and all users with the Configurator role have been given access to view and edit the "Findings by Risk Rating" report:
-
-
Click Update access to save the changes.
Upon the next login, the users or role(s) you have shared the report with can access the shared report.
Access controls for shared reports
The Brinqa Platform provides access controls for shared reports, ensuring that users only have access to the data in the reports that they are authorized to view. Some key points to consider:
-
Users with the Security administrator or System administrator role can grant additional roles the Read role, Read user, and Share reports access controls so that they have the ability to share reports. All three access controls must be assigned for a role to share reports successfully. For additional information, see assign access controls to roles.
-
If a report is shared with a user, they can only see the data if they have the necessary permissions for the associated data. For example, if a report contains vulnerability data, but the user does not have access to those vulnerabilities, they can open the report but will not see any data. Depending on the visualization type, the report may display
"0"or"No data available", indicating that they do not have permission to view the underlying data. -
User access to data in reports is determined by access controls and Clusters. Even if a report is shared, users can only view data they are explicitly authorized to access.
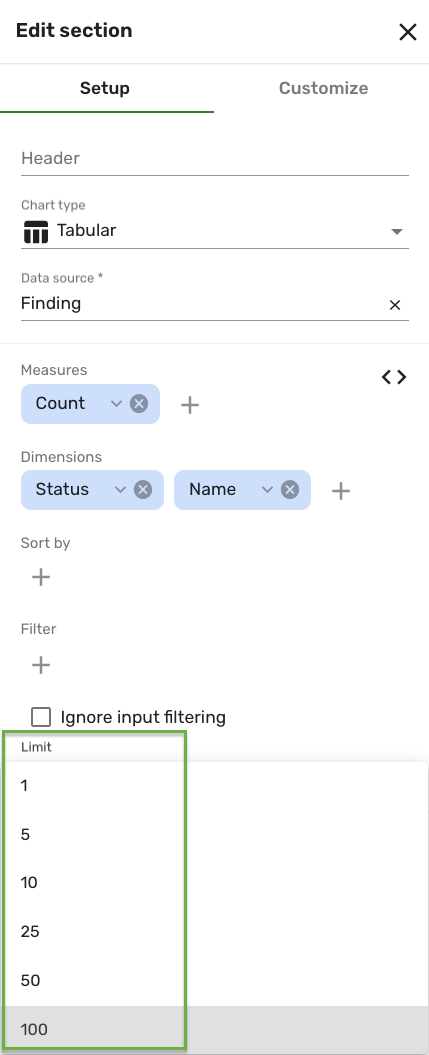
Tabular report limitations
When you create a Tabular report section, the report builder limits the display to a maximum of 100 rows at a time. This limitation, designed to help maintain system performance, prevents your web browser from slowing down when rendering large amounts of datasets.
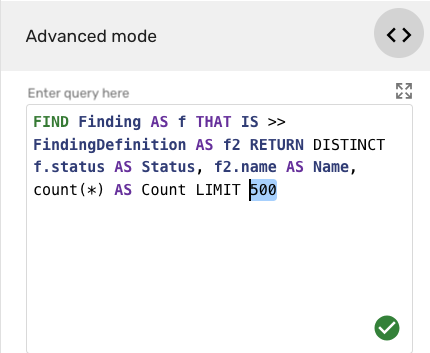
If you configure your Tabular report section to display more than 100 rows using a Brinqa Query Language (BQL) query, as shown in the following example, the system still limits the view to only the first 100 rows.
If you configure your Tabular report section to exceed the data limit of 100 rows, the following warning message appears at the bottom of the Tabular section:
"(!) Data limit exceeded. We are displaying the first 100 rows. To view all the results, export it here".
You can click the export link to download and access all your results beyond the initial 100 rows as a .csv file. This method ensures that you can handle extensive datasets without impacting system performance. To export your tabular report section data, follow these steps:
-
Navigate to the report containing the Tabular report section results you want to export.
-
Scroll to the bottom of the Tabular report section and in the warning message, click here.
The export dialog window displays.
-
Provide a name for the export, and then click Export.

-
Navigate to Account
 > Exports.
 -
Click the name of the export. A new page appears.
-
Click Download.
The
.csvfile containing the entirety of the Tabular results downloads directly to your local storage.