Indicators
Indicators are currently in beta. This documentation is subject to change as the feature develops. Please check back regularly for the latest information.
Indicators are not supported in Brinqa Platform version 12.
This article details indicators and how to create and manage indicators in a Brinqa Platform.
What are indicators?
Indicators in the Brinqa Platform are designed to capture trending data in your environment and provide valuable insights from the moment they are created and first run. The main goal of using indicators is to enable you and your organization to observe fluctuations in your environment and make data-driven decisions based on these insights. By using indicators, you can efficiently monitor and analyze the impact of various factors on your environment, maintaining a focus on your most critical data points. You can think of indicators as a continual gauge, recording the results of Brinqa Query Language (BQL) queries over time, offering a dynamic and ongoing perspective of your environment's status.
Indicators offer numerous benefits that can enhance your experience and provide valuable insights into your data. Some key benefits include:
-
Trend monitoring: Indicators enable you to track changes in your data over time, helping you identify patterns and trends.
-
Enhanced reporting: Indicators can be used to build more comprehensive and meaningful dashboards by showcasing specific metrics and aggregating data from various datasets.
-
Improved decision-making: With access to targeted, up-to-date information provided by indicators, you can make more accurate and data-driven decisions.
-
Customized data representation: Indicators let you tailor your data to represent your specific needs, focusing on the most relevant and valuable information.
Here are a few examples of indicators you can create to monitor trending and identify patterns in your evolving data:
-
Total count of findings: You can monitor the total number of findings across your organization, providing a high-level overview of your organization's security posture and helping you identify trends and patterns in overall risk exposure.
-
Active high-risk vulnerabilities: You can track the number of high-risk vulnerabilities that are currently active in your system, helping you identify and prioritize your most critical security risks. This insight can help you and your organization to allocate resources more effectively and focus on addressing the vulnerabilities that pose the greatest potential threats.
-
Assets with public IP addresses: You can monitor your assets that have public IP addresses, allowing you to better understand your internet-facing attack surface and prioritize the protection of these assets, which may be more susceptible to external threats.
When it comes to the data retrieved by an indicator, access to the data varies based on your role within the Brinqa Platform. There are two main roles: System Administrator and Risk Analyst.
-
System Administrators have access to all data. They can view all indicators and their associated information without restrictions.
-
Risk Analysts, on the other hand, have access to specific items based on their membership in the risk owners or remediation owners clusters. Standard Role-Based Access Control (RBAC) applies to Risk Analysts, meaning that they can only see the data they have access to, including findings, assets, and tickets associated with the ownership clusters they belong to. In order to grant a Risk Analyst access to an indicator or visualization, you must configure a cluster, add the risk analyst to the cluster, and then they will be able to view the relevant data. For additional information, see create an ownership cluster to grant access control.
Create a new indicator
Users with the Configurator or System Administrator role can create new indicators. To create a new indicator, follow these steps:
-
Navigate to Analytics > Indicators.
-
Click Create and fill in the fields below:
-
Title: Give your indicator a title.
-
Description: Provide a description of your indicator.
-
Source: Enter a BQL query to run against the data. Click Test to check if your query is valid and returns the expected data.
-
Properties: Define essential characteristics of the indicator. Properties provide necessary context to shape how the data is presented and analyzed.
-
Attribute: Select an attribute to refine the measure of your indicator. The available attributes pertain to the data model you specify in the BQL query.
- If you choose the "Count" or "Count distinct" option, the attribute field becomes unavailable, as these measures don't rely on a specific attribute.
-
Direction: Set your objective for the indicator's count or values. The chosen direction doesn't alter the data; rather, it can help you clarify whether you aim to minimize or maximize the values over time and can serve as a guide for how you interpret the data. For instance, if you set the direction to Minimize, you are saying that lower values are preferable for your goals, while Maximize suggests the opposite. There are three available direction options to choose from:
-
None: Do not specify a direction.
-
Minimize: Signifies that you aim to decrease the targeted metrics over time, indicating that a lower value is preferable.
-
Maximize: Signifies that you aim to raise the targeted metrics over time, indicating that a higher value is preferable.
-
-
Frequency: Define how often the indicator updates. This ensures that the data stays relevant and timely. You can select from the following options: Daily, Weekly, Monthly, Quarterly, Half Yearly, and Yearly.
-
Key indicator: Designate an indicator as a "favorite" for quick filtering in the indicator list view. This designation doesn't affect the functionality of the indicator in your data analysis or visualizations. Instead, it serves as a sorting tool to quickly access indicators you frequently use or consider important.
-
Maximum values to keep: Determine the length of the list to store the indicator's snapshotted values. Essentially, you can set a limit on how many historical values the indicator retains. For example, if you set the number to be 30, the indicator stores up to 30 values. Once it reaches the limit, the indicator will begin discarding the oldest value each time a new value is added. By default, you would have a rolling window of 30 values worth of data.
-
Measure: Determine how the data is aggregated or calculated on the specified datasets. Options include:
-
Average: The average value of records specified in the BQL query.
-
Count: The sum of records specified in the BQL query.
-
Count distinct: The sum of distinct records specified in the BQL query.
-
Maximum: The current maximum value of the records specified in the BQL query.
-
Minimum: The current minimum value of the records specified in the BQL query.
-
Sum: The sum of values of the records specified in the BQL query.
-
-
Unit: Specify the unit of measurement for the indicator, providing context for interpreting the data. You can select from the following options:
-
None: No unit of measurement.
-
$: U.S. Dollar, for financial data.
-
%: Percentage, for ratio or proportion data.
-
#: Number sign, often used for counts or rankings.
-
€: Euro, for financial data in the Eurozone.
-
-
Value when missing data: Decide what to display if data is missing from your indicator. If not configured, the system displays "No data to display" in the indicator.
-
-
Breakdowns: Add additional attributes from the target data model to provide more granular insights. For example, if you create an indicator with the "Count" measure for findings, you can add breakdowns by "Severity" and "Status". This will save not only the total count but also the counts of each finding categorized by their status and severity levels.
- Click +, and then click the Attribute dropdown to select from a list of attributes to include in the indicator.
-
-
Click Create.
The new indicator displays in the Indicators list view. If you do not see it, refresh the page. Click the Title of your indicator to view trending details, historical changes, and a visual representation of the data related to that specific indicator.
Your indicators compute and gather data as a part of your data orchestration, but you can also run them manually.
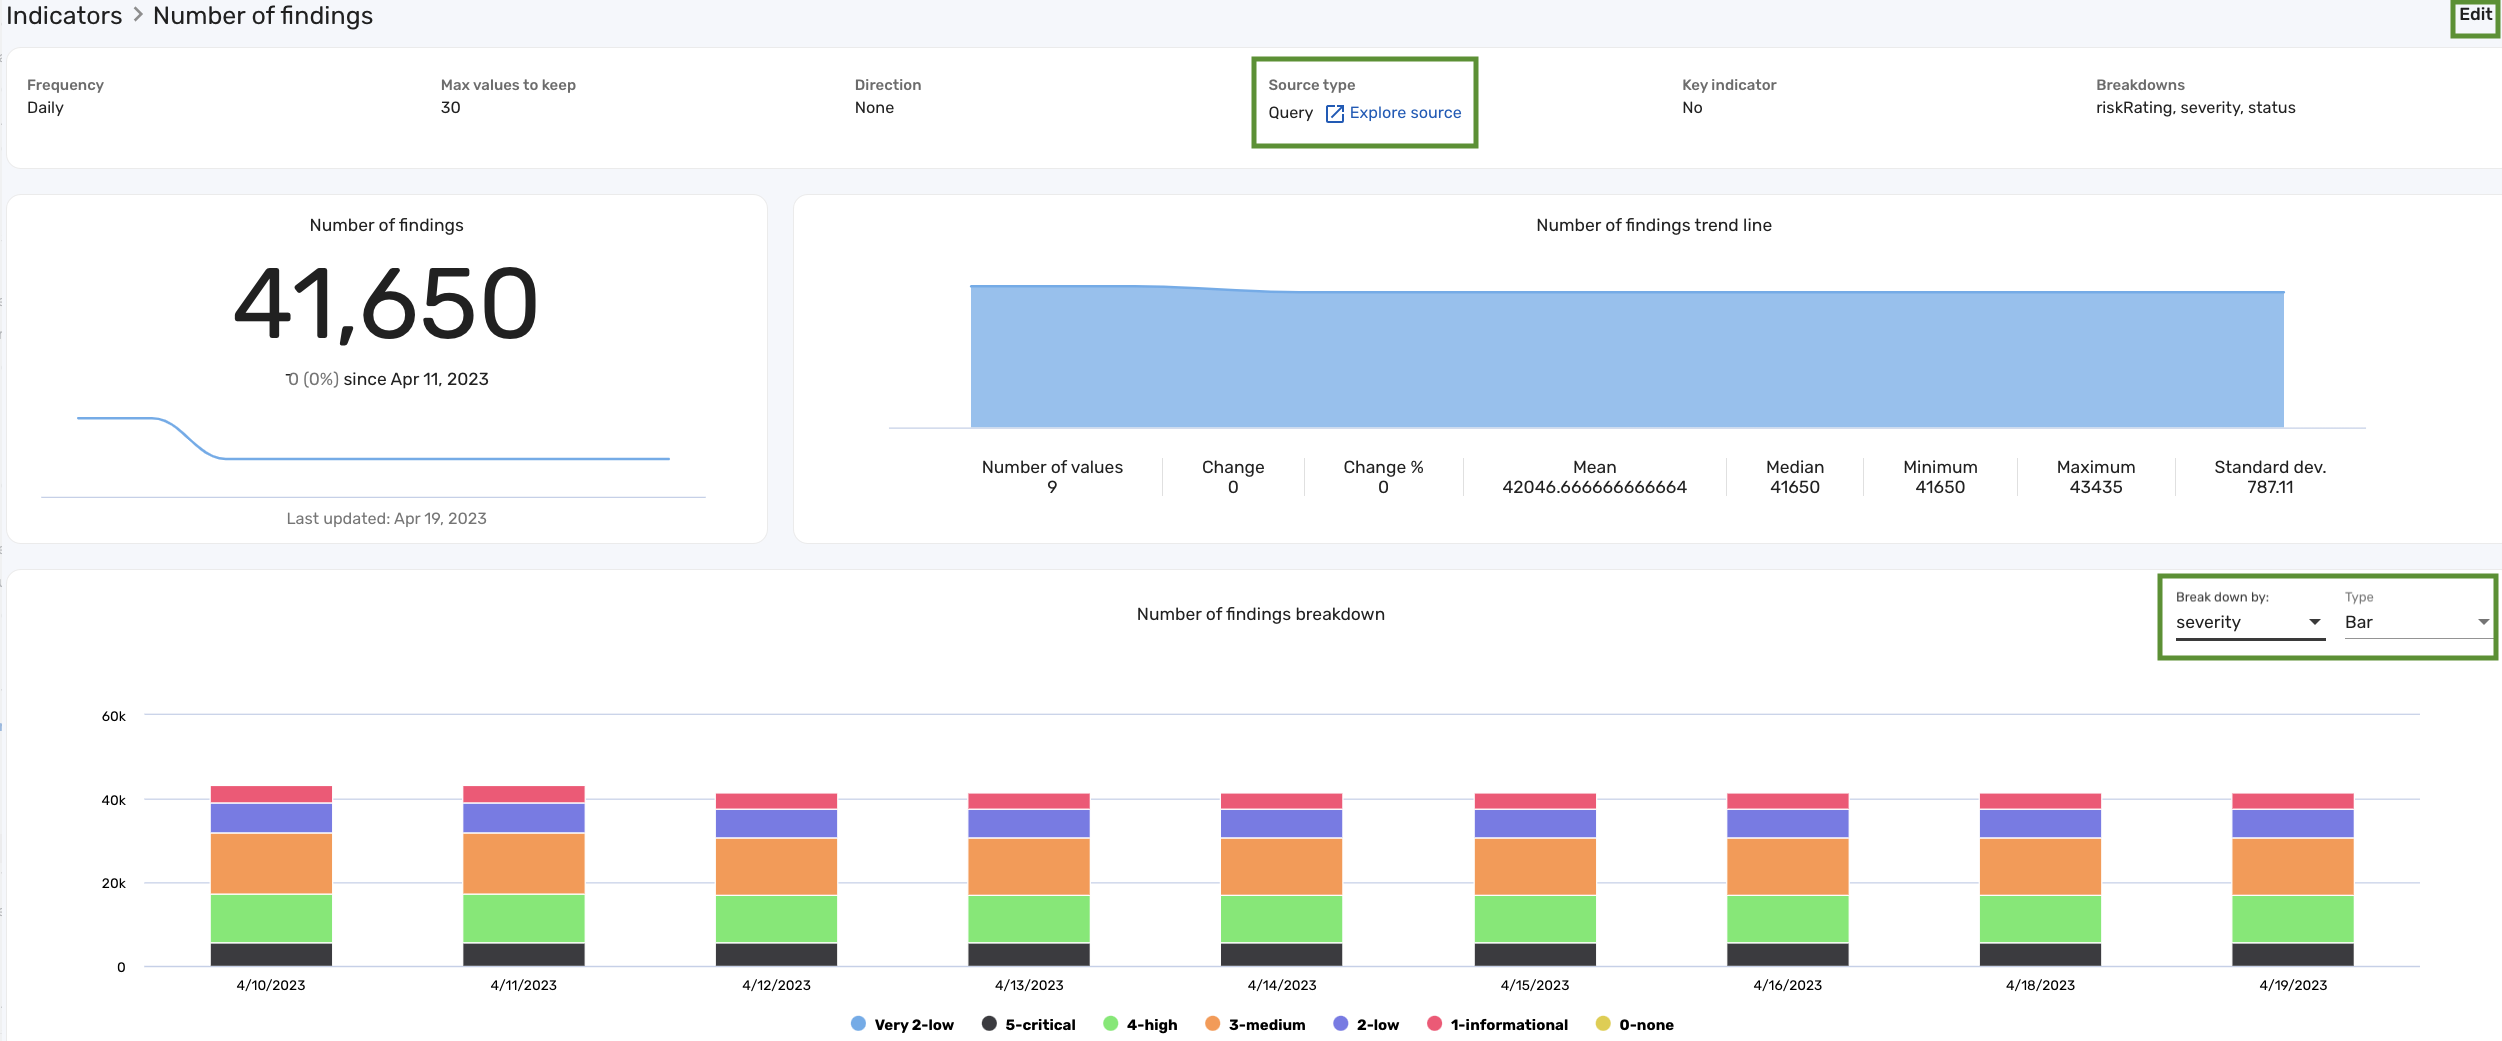
The above screenshot illustrates an indicator created to show trending data for the total number of findings in a system. The information on this page may change as new data is ingested into the Brinqa Platform.
Besides examining the trending data, you can also click Explore source under "Source type" to view the data on the Explorer graph, click Edit to modify the indicator, select a different breakdown from the Break down by dropdown, or choose another chart type using the Type dropdown. For example:
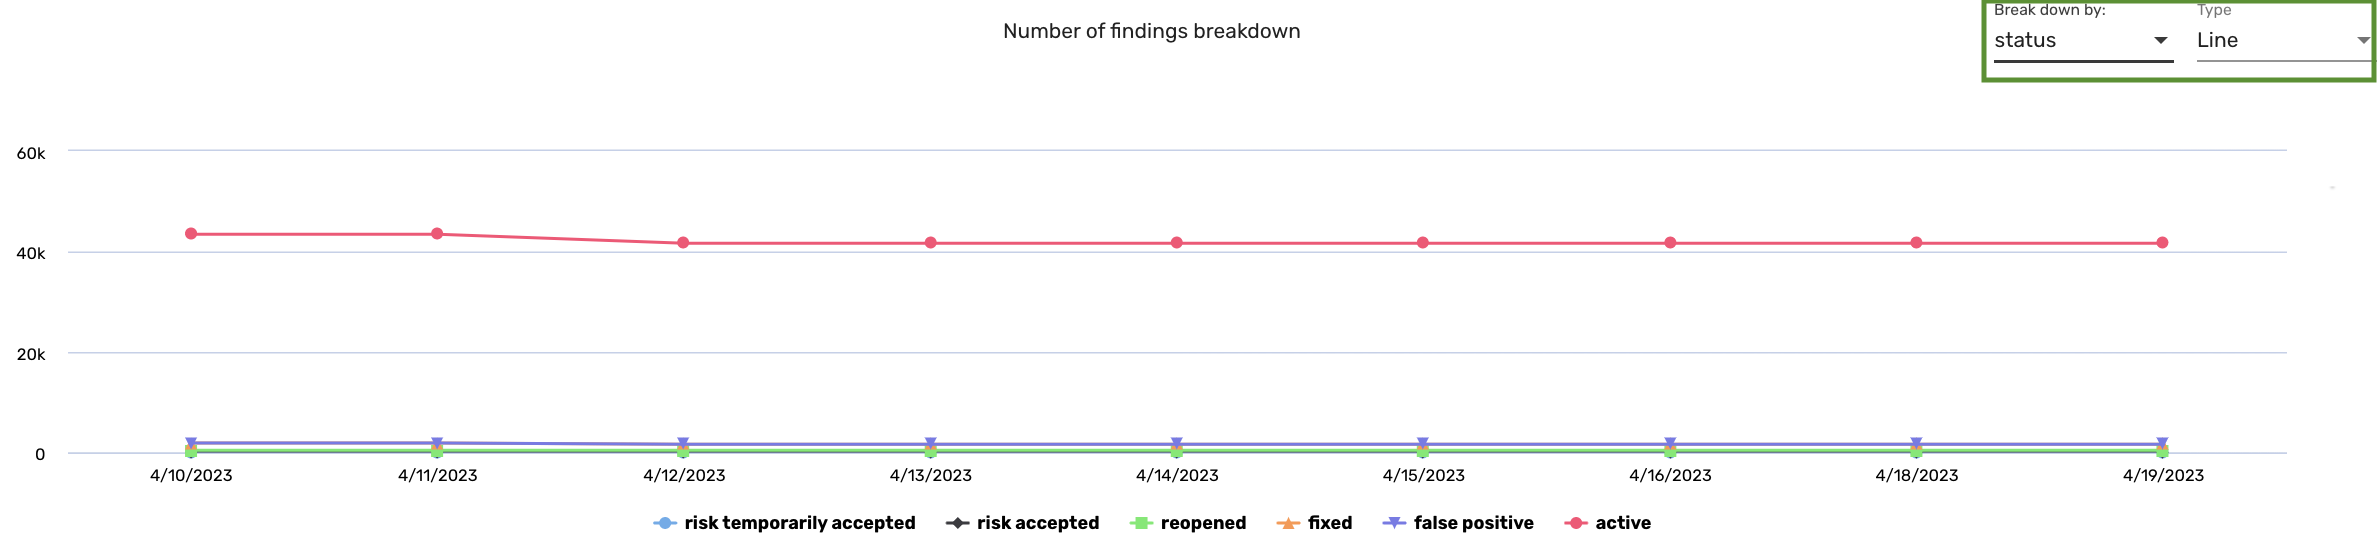
The same "Number of Findings" indicator is shown above, but it now displays findings by their status instead of severity by changing the breakdown, and the chart has been changed to a Line chart. This demonstrates the flexibility of the indicator, allowing you to customize the display to better understand and analyze the data.
You may need to wait a few days in order to see trending data. If you create the indicator and immediately view it, you can only see the current data retrieved by the indicator and not how your data has potentially changed over time.
Run indicators
Your indicators compute when the data orchestration runs. However, if you want your changes to take effect immediately after creating, updating, or removing an indicator, follow these steps:
-
Navigate to Administration
 > Automation > Flows.
 -
Click View all next to "Recent folders" or "Recent flows".
-
In the search bar under "All flows", type "Storage Indicator".
-
Click the "Storage Indicator" flow in the list view, click Launch, and then click Launch again in the confirmation dialog.
The "Storage Indicator" flow runs and computes the data for all of your indicators.
View and manage indicators
Users with the Configurator or System Administrator role can view and manage existing indicators. To do so, follow these steps:
-
Navigate to Analytics > Indicators.
-
To modify an indicator, point your cursor over the indicator and click Edit.
-
Modify the fields as needed and click Update.
While you can edit existing indicators, you can only modify the title, description, and direction.
Tutorial: Create a vulnerability indicator and use it in a dashboard
This tutorial demonstrates how you can create a new indicator to track the trending of vulnerabilities in your system and use it in a dashboard. Creating an indicator for vulnerabilities in your Brinqa Platform can be useful for a few reasons:
-
Prioritize remediation efforts: A clear view of your vulnerabilities lets you and your organization focus on the most severe threats to your environment.
-
Monitor trends and track progress: Tracking the number and severity of vulnerabilities over time can help you identify patterns, assess the effectiveness of your security measures, and measure the success of your vulnerability management program(s).
-
Informed decision-making: By keeping a close eye on your vulnerabilities, you can make data-driven decisions to allocate resources and invest in solutions that address these high-risk issues.
To create the vulnerabilities indicator, follow these steps:
-
Navigate to Analytics > Indicators.
-
Click Create and fill in the fields as shown below:
-
Name: Type "All Vulnerabilities".
-
Description: Give your indicator a description. For example, "This indicator is used to track and monitor all vulnerabilities."
-
Source: Type the following BQL query. This query retrieves all vulnerabilities in your system:
FIND Vulnerability AS v -
Click Test to see the results retrieved by the query.
-
Properties: Enter the following properties:
-
Measure: Select Count. Count retrieves the total count of vulnerabilities in your system.
-
Direction: Select Minimize. Minimize specifies that the goal of this indicator is to minimize the amount of vulnerabilities in your system.
-
Frequency: Select Daily. The indicator updates everyday.
-
Unit: Leave as is. The default is None.
-
Maximum values to keep: Leave as is. The default value is 30.
-
Value when missing data: Leave as is. The default is 0.
-
Key indicator: Leave as is.
-
-
Breakdowns: Click + and add the following attribute breakdowns:
-
Click the Attribute dropdown, select Status, and then click Add. This breakdown lets you categorize vulnerabilities by their status category. Status categories include active, reopened, fixed, false positive, or risk temporarily accepted.
-
Click the Attribute dropdown, select Severity, and then click Add. This breakdown lets you categorize vulnerabilities by their severity level. Severity levels include none, informational, low, medium, high, or critical.
-
Click the Attribute dropdown, select Risk rating, and then click Add. This breakdown lets you categorize vulnerabilities by their risk rating. Risk ratings include none, low, medium, high, or critical.
-
-
-
Click Create.
The Indicators page reloads and the "All Vulnerabilities" indicator displays. If you do not see it, refresh the page.
The "All Vulnerabilities" indicator computes when the data orchestration runs. However, if you want it to compute and go into effect immediately, see run indicators for steps on how to do so.
Create a visualization for the all vulnerabilities indicator
Once you've created the "All Vulnerabilities" indicator, you can then create a visualization to further illustrate it. A visualization offers a graphical representation of your data, letting you easily identify trends and patterns within the Brinqa Platform. By creating a visualization for the 'All Vulnerabilities' indicator, you can not only enrich your dashboards, but also facilitate a more impactful, visual comprehension of your data. For additional information, see Visualizations. To create a visualization for the "All Vulnerabilities" indicator, follow these steps.
-
Navigate to Analytics > Visualizations.
-
Click Create and fill in the fields as shown below:
-
Title: Type "All vulnerabilities".
-
Source type: Click the dropdown and select Indicator.
-
Header: (Optional) provide a header for the visualization.
-
Indicator: Click the dropdown and select All Vulnerabilities. This is the indicator you created earlier.
- The visualization refreshes on the page and updates with the vulnerability data retrieved by the indicator.
-
Chart type: Click the dropdown and select Trend value. The Trend value chart type also gives you the ability to view trends and changes in your data.
- By default, Show last updated, Show trend, Show change, Show percentage, and Show indicator title are checked. Leave these as is. Selecting these boxes ensures that when the data changes, the visualization updates to show those updates automatically.
-
-
Click the Style tab and modify the appearance of the visualization as desired. See customize section appearance for additional information.
-
Click Save.
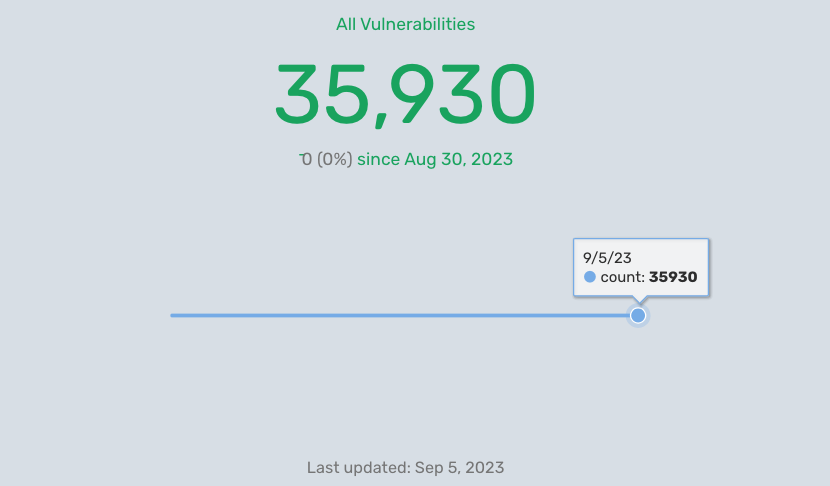
The Visualizations page reloads and your new visualization displays in the list view. If you do not see it, refresh the page. The following screenshot illustrates what the visualization may look like.
Add the all vulnerabilities visualization to a dashboard
You can now add this visualization to a dashboard. To do so, follow these steps:
-
Navigate to Analytics > Dashboards.
-
Click the dashboard you want to add this visualization to.
-
Click Edit on the upper-right corner.
-
Click Add section
 .
. -
Under Visualizations, click Choose visualization
 .
. -
The Choose a visualization window appears. Point the cursor over the All Vulnerabilities visualization and click Select.
The dashboard refreshes and the All Vulnerabilities visualization displays on the dashboard. You cannot edit the visualization on the dashboard. You must navigate to Analytics > Visualization if you want to make modifications to the visualization.