Dashboards Overview
This article details dashboards in the Brinqa Platform, how to create a new dashboard, create dashboard folders, limit access to dashboards, clone dashboards, share dashboards, and more.
What are dashboards?
Dashboards in the Brinqa Platform give you a way to present, visualize, and analyze the cybersecurity data collected from various data sources, such as vulnerability scanners, asset management systems, and threat intelligence feeds. Dashboards enable you to gain insights into your organization's security posture, track the progress of risk mitigation efforts, and make data-driven decisions to improve your overall cybersecurity posture.
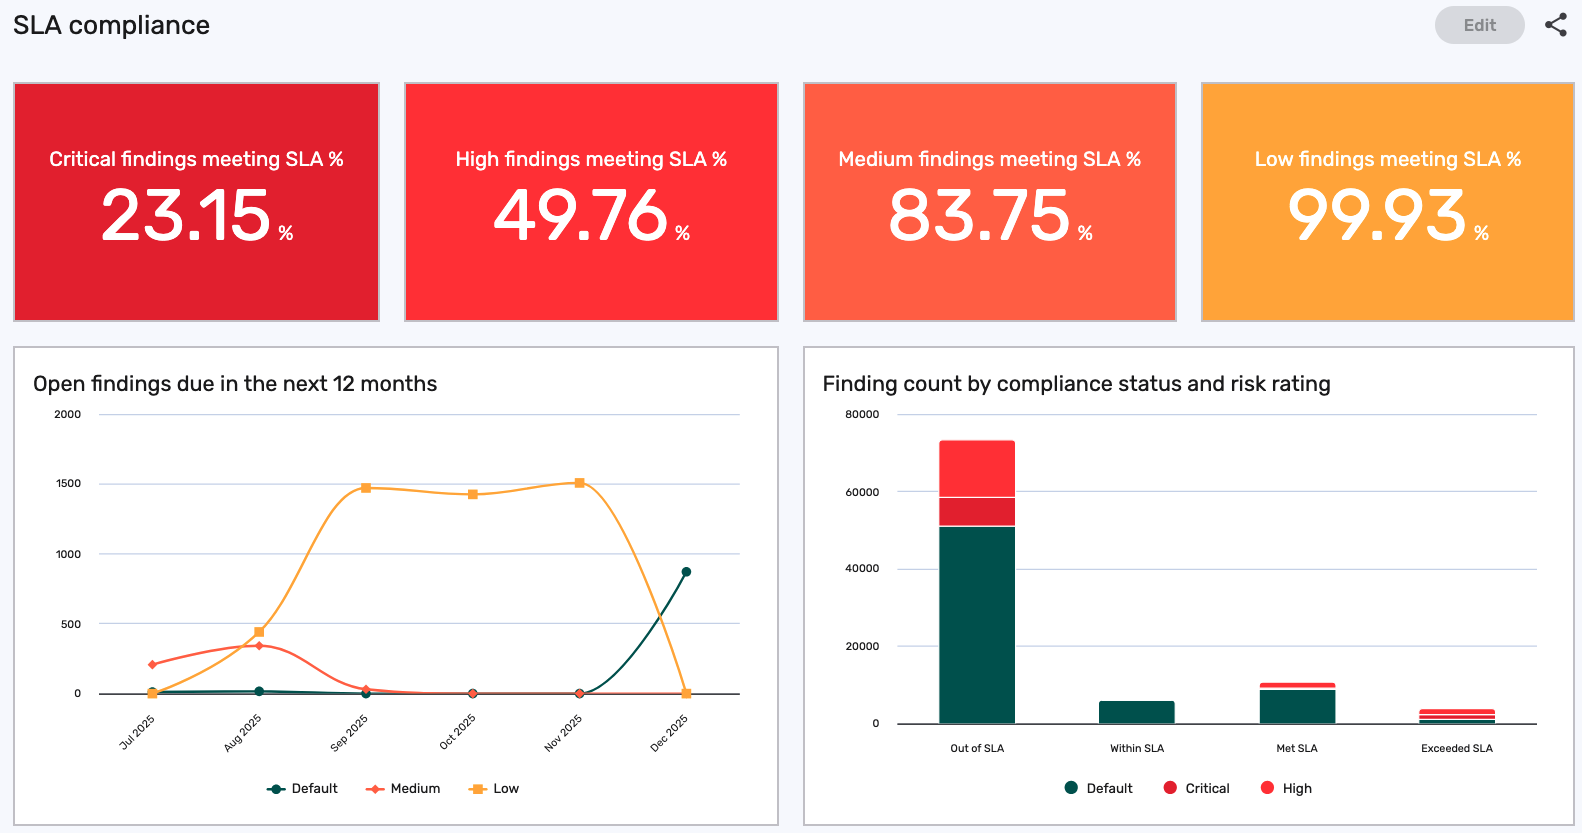
Dashboards are extremely flexible and powerful due to the graph data model and the use of API calls to retrieve data. It allows the system to dynamically create subsets of data based on any attributes in a data model, provide in-dashboard filtering, and display data on dashboards more quickly. You can customize dashboards in the Brinqa Platform to meet the specific needs of different stakeholders, such as executives, security managers, or IT teams. Dashboards can include various charts, graphs, and tables, displaying information such as risk scores, vulnerability trends, or asset inventory. For example, the following screenshot illustrates an example of a compliance dashboard that tracks findings and their compliance status:
Here are some common types of dashboards you can build in the Brinqa Platform:
-
Executive summary: Provide an overview of your organization's cybersecurity posture and highlight key risk metrics.
-
Risk and vulnerability: Offer detailed information on risk scores, vulnerabilities, and remediation status for individual assets or groups of assets.
-
Security trend: Track changes in your security posture over time, identifying emerging threats and the effectiveness of remediation efforts.
The Brinqa Platform includes three different dashboard-related pages, each serving a unique purpose:
-
Dashboards main page: Click Dashboards in the top navigation bar to access this page. It displays all dashboards and folders that have been promoted for the current user or role. This page is intended for quickly viewing and exploring dashboards relevant to your responsibilities.
-
Dashboards list page: Navigate to Analytics > Dashboards to view, create, edit, favorite, and share dashboards, as well as organizing them into folders. This is the primary workspace for building and managing dashboards
-
Dashboard layout page: Navigate to Administration > User Interface > Dashboard Layout to manage the layout and visibility of all dashboards in the Brinqa Platform. This page is available only to users with the System administrator role. You can rename folders, reorganize dashboards and folders, promote dashboards, and control how dashboards appear to different users or roles. You cannot create new dashboards from this page. For additional information, see Change dashboard layout.
Built-in dashboards
The Brinqa Platform includes several built-in dashboards that operationalize your organization's Risk Management program, enabling administrators, risk owners, and remediation owners to monitor key metrics and take action based on their specific responsibilities:
Several dashboards are temporarily unavailable in the initial release of Brinqa Platform version 12 due to their dependency on Analytics source, which is not yet available. The affected dashboards include: Remediation Owner dashboards, Risk Owner dashboards (except 'Findings by Remediation Owners'), and System Administration dashboards. These dashboards will return once Analytics source support is added in a future version 12 update.
Table 1: Built-in dashboards
| Dashboard Folder | Dashboards | Description |
|---|---|---|
| Application Security | OWASP TOP 10 (2021) | Categorizes assets and findings according to the OWASP Top 10 2021 framework, helping you identify and prioritize the most common web application security vulnerabilities. |
| OWASP TOP 10 (2025) | Organizes assets and findings according to the OWASP Top 10 2025 framework, providing insights into the latest web application security threats and vulnerabilities. | |
| Asset management | Asset Risk Factors | Displays insights into assets with active risk factors, showing the asset count for each risk factor. |
| Domains | Categorizes assets by their respective domains, distinguishing between traditional (e.g., servers, workstations), cloud-based (e.g., containers), and AppSec (e.g., packages, applications) assets. | |
| Newly Discovered | Groups assets according to their data model, data source, risk rating, and type. | |
| Scorecard | Shows risk scores and risk distribution among assets, with a detailed breakdown by asset type. | |
| Tags | Summarizes asset tag information, including the number of tags currently in use and the percentages of tagged and untagged assets. | |
| Director | Asset Impact | Summarizes affected assets with open findings, categorized by asset profile, asset type, business service, business unit, and company. |
| Critical Assets | Presents an up-to-date analysis of critical assets and their associated findings, including those exposed to the internet, compliant with PCI or PII regulations, or supporting revenue-generating business operations. | |
| Finding Impact | Displays comprehensive risk-related information, including key risk factors, risk score distributions, and open findings categorized by type, remediation owner, and risk owner. | |
| Findings by Business Unit | Breaks down findings by business unit to help risk analysts and security leaders assess vulnerability distribution across different business areas. | |
| Findings by Risk Owners | Organizes findings in a table with each row representing a remediation team and columns showing counts by risk rating. | |
| Remediation Lifecycle | Monitors the effectiveness of remediation initiatives, showing remediation progress, SLA compliance, average days to resolution, open findings with remediation requests, and open findings within tickets. | |
| Remediation | Remediation Campaigns | Monitors the progress and SLA compliance of remediation campaigns across risk owners, remediation owners, and campaign owners. |
| Remediation owner | Act | Prioritizes critical items requiring immediate attention, including open findings that are overdue or nearing SLA deadlines and related requests. |
| Comply | Provides insights into SLA deadline adherence and the nature of assigned findings that may affect compliance. | |
| Monitor | Tracks remediation responsibilities and activities over time, including assigned assets, findings, tickets, and requests. | |
| Risk management | CVE Record CVSS Coverage | Shows the distribution of CVSS versions (2.0, 3.1, 4.0) across CVE Record data. |
| Finding Aging | Tracks the average age of findings by risk rating and business service, including weekly trends to monitor how long findings remain open. | |
| Finding Definition CVSS Coverage | Shows the distribution of CVSS versions (2.0, 3.1, 4.0) across your Finding Definition data. | |
| Finding Overview | Provides a high-level view of total findings, average risk score, and the distribution of open and recently fixed findings by risk rating. | |
| Findings Summary | Offers a comprehensive view of findings by age, risk rating, recent activity, top exploited findings, and SLA compliance. | |
| Risk Analysis | Presents total assets, findings, and risk metrics, highlighting top risk finding definitions to enable identification and prioritization of entire classes of threats. | |
| SLA Compliance | Displays SLA compliance percentages for each risk rating, open findings due in the next 12 months, and finding counts by compliance status and risk rating. | |
| Top Findings | Identifies the most frequently occurring findings, with breakdowns for critical findings, SLA breach findings, and critical SLA breach findings. | |
| Risk owner | Act | Highlights critical items requiring immediate attention, focusing on findings that are overdue or nearing SLA deadlines. |
| Comply | Shows SLA compliance status and the nature of findings within scope, helping assess risk management effectiveness. | |
| Findings by Remediation Owners | Organizes findings in a table with each row representing a remediation team and columns showing counts by risk rating. | |
| Monitor | Provides insights into areas of responsibility, tracking trends in assigned assets, findings, tickets, and requests. | |
| System administration | Operations | Provides detailed insights into data orchestration, integrations, and SDM processing to support optimization decisions. |
| Data Quality | Displays an overview of data integrity, highlighting gaps and problematic identifiers to ensure accurate consolidation. | |
| System Health | Monitors Brinqa Platform performance and server health to ensure smooth operation. | |
| User Management | Tracks user accounts and access, enabling administrators to remove stale accounts and optimize resources for platform security and efficiency. | |
| Threat posture | Application Assets | Monitors AppSec threat posture, including packages, applications, and related assets, with insights into data sources, remediation ownership, and risk factors. |
| Cloud Assets | Monitors cloud threat posture, including containers and cloud-based infrastructure, with insights into data sources, remediation ownership, and risk factors. | |
| Exploit Maturity | Displays findings with exploits and how mature those exploits are (public, commercial, or weaponized exploits). | |
| Exploitable Threats | Displays finding definitions with known exploits, showing exploited in the wild and exploitable findings by risk rating, SLA status, and recent discoveries. | |
| Exploited in the Wild | Displays findings known to be exploited in the wild, as reported by Brinqa Risk Intelligence, and highlights the assets most affected by these exploits. | |
| Traditional Assets | Monitors traditional threat posture, including servers, workstations, and network devices, with insights into data sources, remediation ownership, and risk factors. |
Access controls for dashboards
The Brinqa Platform provides access control for dashboards, ensuring that users only have access to the dashboards that they are authorized to view. Some key points to consider:
-
Users with the Security administrator or System administrator role can grant other roles the Read role, Read user, and Share Dashboards access controls so that they have the ability to share dashboards. For additional information, see assign access controls to roles.
-
The dashboard navigation menu only displays the dashboards that the current logged-in user has permission to view. You can manage access to dashboards through the dashboard's sharing feature by adding users or roles to grant them permission to view dashboards.
-
The built-in dashboards are pre-configured based on roles. For instance, to see data in the Remediation owner dashboards, users must be associated with the relevant findings or assets through the Remediation owner cluster and have either the Risk owner or Remediation owner role assigned to them.
-
If a dashboard is shared with a user, they can only see the data if they also have the necessary permissions for the associated data. For example, if a dashboard related to vulnerabilities is shared with a user who does not have access to those vulnerabilities, the user sees the dashboard in the navigation menu, but can't view any of the data on it. Depending on the visualization type, it may display
"0"or"No data available", indicating that they don't have permission to view the underlying data.
The following table lists the available roles and their associated permissions for dashboards:
Table 2: Dashboards access controls
| Role | Permissions |
|---|---|
| Data exporter | Snapshot dashboards |
| Configurator | Create, read, update, delete, share, promote, and manage dashboards; manage dashboard layout |
| Promoter | Promote dashboards |
| Remediation owner | Create, read, update, delete, and share dashboards |
| Risk owner | Create, read, update, delete, and share dashboards |
| System administrator | All dashboard permissions |
Organize dashboards
You can manage your dashboards by using folders, favoriting your most frequently used dashboards, and promoting dashboards to the main Dashboards page.
Dashboard folders
You can organize your dashboards into folders to make them easier to find and manage. Each folder can contain multiple dashboards, and you can create as many folders as needed. Any dashboard not assigned to a folder appears in the "Not in a folder" section in the left navigation menu.
Create a dashboard folder
Users with the Configurator or System administrator role can create dashboard folders.
To create a new dashboard folder, follow these steps:
-
Navigate to Analytics > Dashboards.
-
Click New folder in the left navigation menu.
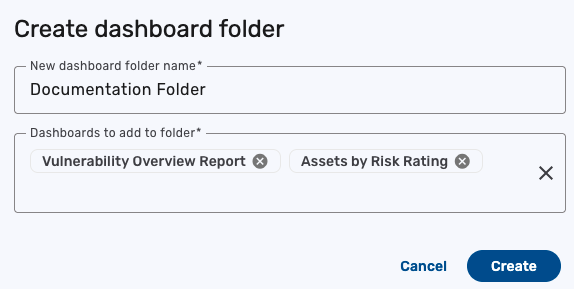
The Create dashboard folder dialog appears. Complete the following fields:
-
Name: The name of the folder. The name appears in the left navigation menu.
-
Dashboards to add to folder: Click the dropdown and select one or more dashboards to add to the folder. You can also add more dashboards to the folder later.
-
-
Click Create.
After you create the new folder, the Analytics > Dashboards page reloads, and your new folder appears in the left navigation menu. All dashboards assigned to the folder are moved into that folder and no longer appear in the "Not in a folder" section.
You can also create a folder while creating a new dashboard or assigning a dashboard to a folder.
Move a dashboard to a folder
After creating a folder, you can move existing dashboards to a folder or move dashboards between folders at any time.
To move a dashboard to a folder, follow these steps:
-
Navigate to Analytics > Dashboards.
-
Click the checkbox next to the dashboard(s) you want to move to a folder.
-
Click Move to a folder in the toolbar above the list view.
The Move dashboards to a folder dialog appears.
-
In the Move dashboards to a folder dialog, you have two options:
-
Option 1: Click an existing folder to move the dashboard to it.
-
Option 2: In the Or create a new folder text box, type a folder name to create a folder and move the dashboards in one step, and then click Create.
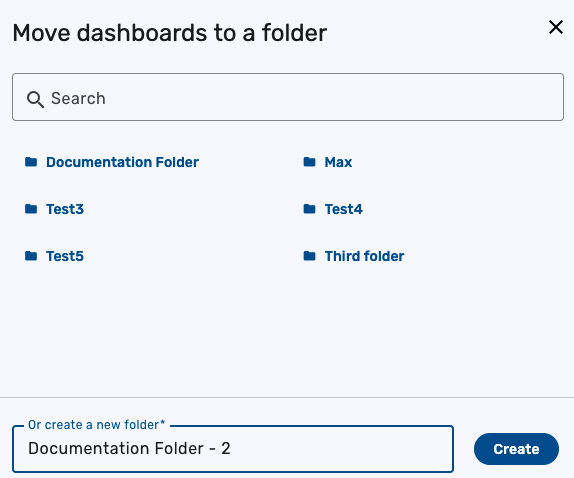
The dashboard(s) move to the selected folder.
-
Remove a dashboard from a folder
You can remove a dashboard from a folder at any time. Removing a dashboard from a folder does not delete the dashboard. Instead, any dashboards you remove are automatically moved to the "Not in a folder" section in the left navigation menu.
To remove a dashboard from a folder, follow these steps:
-
Navigate to Analytics > Dashboards.
-
Click the folder that contains the dashboard you want to remove.
-
Click the checkbox next to the dashboard(s) you want to remove.
-
Click Remove from a folder in the toolbar above the list view.
-
Click Confirm in the confirmation dialog.
The dashboard is removed from the folder and is then moved to the "Not in a folder" section in the left navigation menu.
Rename a dashboard folder
You can rename dashboard folders at any time. To rename a dashboard folder, follow these steps:
-
Navigate to Analytics > Dashboards.
-
In the left navigation menu, hold the pointer over the folder you want to rename, and then click the pencil icon that appears next to the folder name.
-
In the Rename folder dialog, type the new name for the folder in the New folder name text box.
-
Click Rename.
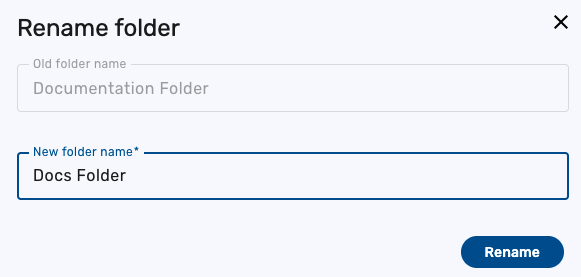
The folder is renamed, and the new folder name appears in the left navigation menu.
Delete a dashboard folder
You can delete dashboard folders at any time. Deleting a folder does not delete the dashboards inside it. Instead, any dashboards assigned to the folder are automatically moved to the "Not in a folder" section in the left navigation menu.
To delete a dashboard folder, follow these steps:
-
Navigate to Analytics > Dashboards.
-
In the left navigation menu, hold the pointer over the folder you want to delete, and then click the trash can icon that appears next to the folder name.
-
Click Delete in the confirmation dialog.
The folder is deleted, and any dashboards that were in the folder are automatically moved to the "Not in a folder" section.
Favorite a dashboard
You can favorite a dashboard to quickly access it from the My favorites folder in the left navigation menu.
To favorite a dashboard, follow these steps:
-
Navigate to Analytics > Dashboards.
-
You have two options:
-
Option 1: Click the Star icon (Add to favorites) next to the dashboard name in the list view
-
Option 2: Click the checkbox next to the dashboards you want to favorite, click Favorite in the toolbar above the table, and then click Confirm in the confirmation dialog.
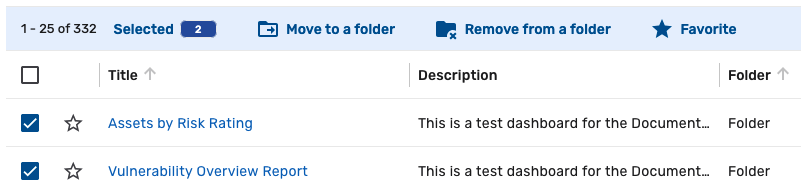
The dashboard is added to the My favorites folder in the left navigation menu and they are also listed first on the Analytics > Dashboards page.
To remove a dashboard from your favorites, follow the same steps as above, but click Remove from favorites instead. You can also click the solid Star icon next to the dashboard name in the list view.
-
Promote a dashboard
Promoting a dashboard makes it, along with the folder it's in, appear on the Dashboards main page for the specified users or roles.
Users with the Configurator, Promoter, or System administrator role can promote dashboards. To promote a dashboard, follow these steps:
-
Navigate to Analytics > Dashboards.
noteSystem administrators can also navigate to Administration > User Interface > Dashboard Layout to promote dashboards. For additional information, see Change dashboard layout.
-
Hold the pointer over the dashboard you want to promote, and then click Share.
-
In the Share dashboard dialog, share the dashboard with the desired users or roles.
-
Click the Promote toggle next to each user or role you want to promote the dashboard to
-
Click Update access to save the changes.
The dashboard, and its corresponding folder, now display on the main Dashboards page for that user or role.
Change dashboard layout
The Dashboard layout page is available only to users with the System administrator role and is used to organize how dashboards and folders appear on the Dashboards list page. You cannot create new dashboards from this page, but you can rename folders, move dashboards between folders, promote dashboards, and manage sharing settings.
To access the Dashboard layout page, navigate to Administration > User Interface > Dashboard Layout.
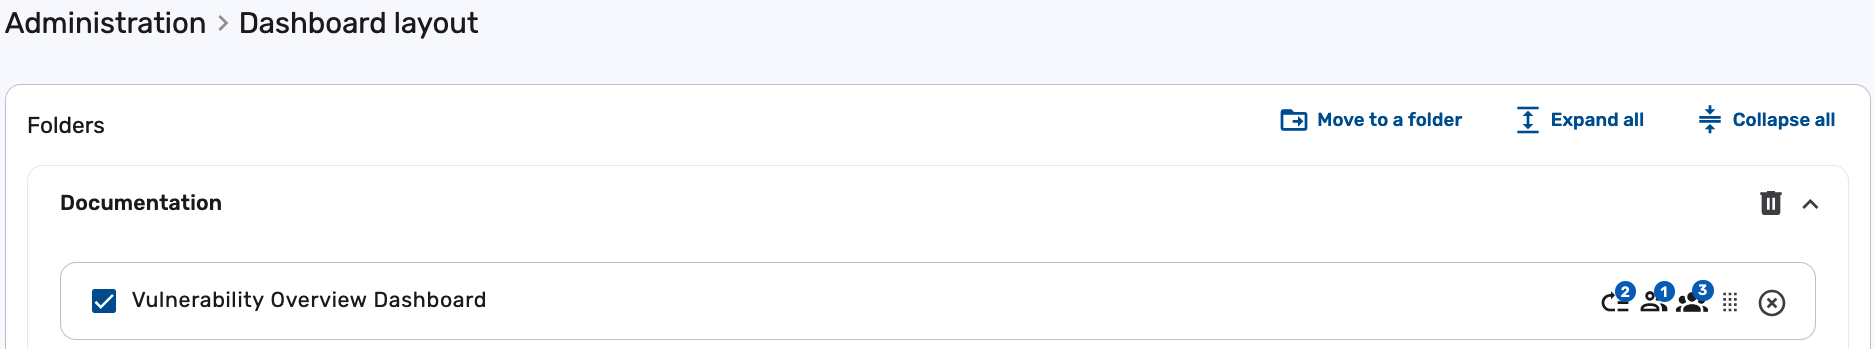
Each dashboard includes visual indicators that show how it is currently shared and promoted. These icons appear to the right of the dashboard name and display tooltips when hovered over.
In the following screenshot, the "Vulnerability Overview Dashboard" has been promoted to 2 users and 2 roles, shared with 1 user, and shared with 3 roles:
Manage dashboards
You can create dashboards from scratch, clone existing ones, customize their appearance, add dynamic inputs for filtering, and share them with other users.
Create a new dashboard
While your Brinqa Platform contains some default dashboards built in, you can also create your own dashboards as desired.
Users with the Configurator, Remediation owner, Risk owner, or System administrator role can create new dashboards. To create a new dashboard, follow these steps:
-
Navigate to Analytics > Dashboards.
-
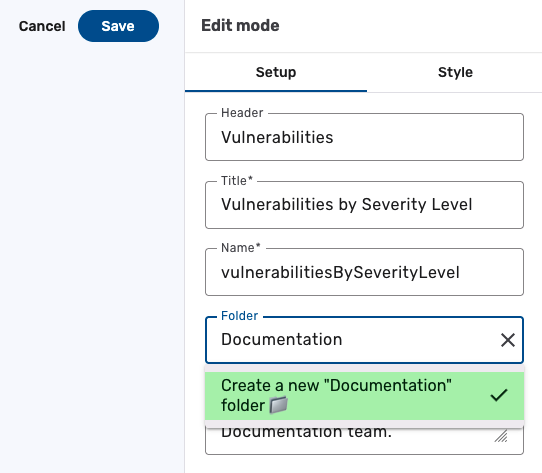
Click Create, and in the Setup tab, fill in the following information:
-
Header: The header of the dashboard. The header appears at the top of the specific dashboard page.
-
Title: The title of your dashboard. The title is displayed on the Dashboards list view.
-
Name: The referenced name of the dashboard for queries and scripts. The system fills in the name as you type the title, removing any spaces or characters that are not allowed. You do not need to edit this field.
-
Folder: The folder to which you want to assign the dashboard. You can create a new folder or select an existing one. If you do not select a folder, the dashboard appears in the "Not in a folder" section in the left navigation menu. For additional information, see dashboard folders.
-
Description: The description of the dashboard. The description is displayed on the dashboard list view and can be searched using the search bar.
-
-
Click Save. The page reloads and your new dashboard appears.
Your new dashboard is created, but it only serves as the scaffolding for your data. Dashboards remain empty until you add dashboard sections, such as graphs, charts, or tables. Continue building your dashboard by adding sections, configuring filters or inputs, and customizing the layout.
Clone a dashboard
You can clone an existing dashboard to create a new dashboard with the same sections and configurations. This is useful when you want to create a similar dashboard without starting from scratch.
To clone a dashboard, follow these steps:
-
Navigate to Analytics > Dashboards.
-
Hold the pointer over the dashboard you want to clone, and then click Clone.
-
The dashboard builder opens with the cloned dashboard. Modify the cloned dashboard as needed, and then click Clone.
The cloned dashboard is created and appears in the list view of dashboards.
Customize dashboard appearance
After creating a new dashboard, you can modify the appearance of the dashboard. To do so, follow these steps:
-
Navigate to Analytics > Dashboards and choose the dashboard you want to modify.
-
Click Edit, then Style, and edit the following fields as needed:
-
Width and margin: Customize the width and the four margins of the dashboard. You can also select Fit to width and No margin.
-
Background and border: Customize the dashboard background color, border color, border width, border radius, or enable a border shadow.
-
Sections background and border: Customize the background and borders of the sections on the dashboard.
-
Actions: Enable fullscreen for the dashboard.
-
-
Click Update.
Add inputs
Inputs enable you to dynamically filter the contents of the entire dashboard. For example, you can create a vulnerability dashboard that initially displays information about all existing vulnerabilities in your Brinqa Platform. Then, you can add an input to only show information on the vulnerabilities found in the last 30 days, or only show vulnerabilities with a specific status, such as "Confirmed active".
To add different inputs to your dashboard, follow these steps:
-
Navigate to Analytics > Dashboards.
-
Click the dashboard you want to add or change the input for.
-
Click Edit, then click Inputs
 .
. -
Click the Data model dropdown and choose the same data model as the dashboard.
-
Click Add inputs and choose the attribute for the filter. For example, Status.
-
Click Add, and then click Update to save the changes.
The new input displays as a filter at the top of the dashboard:
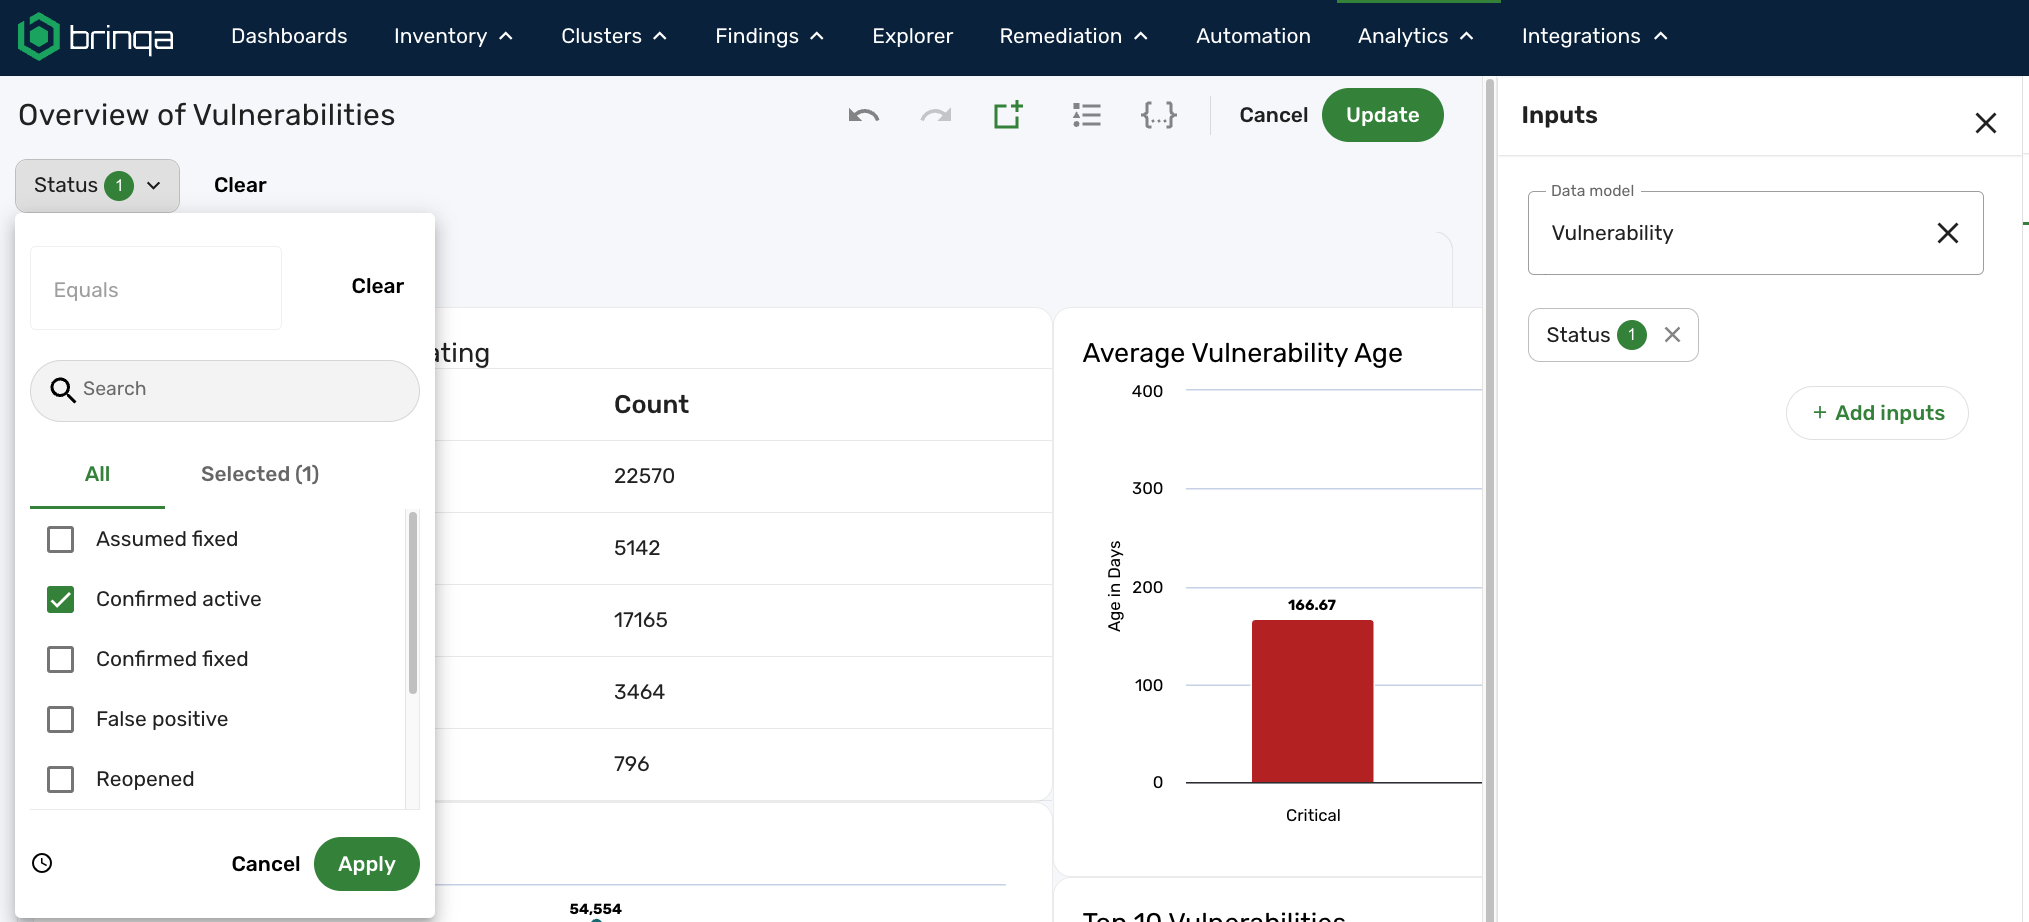
You can then use this new input like you would a basic search filter to limit the dataset for the dashboard. If you do not want this filter to be applied to a certain section, edit the section and select Ignore input filtering in the Setup tab.
Repeat these steps for each input you want to add to your dashboard. See step 8 in the Build a custom dashboard tutorial to see how an input can change the data presented in your dashboard.
Share a dashboard
Sharing dashboards in the Brinqa Platform enables you to grant specific users or all users with a certain role the permission to view and interact with certain dashboards.
Users with the Configurator, Remediation owner, Risk owner, or System administrator role can create, edit, delete, and share dashboards with other users in the Brinqa Platform.
Users with the Security administrator or System administrator role can grant other roles the Share Dashboards access control so that they have the ability to share dashboards. For additional information, see assign access controls to roles.
To share a dashboard, follow these steps:
-
Navigate to any dashboard in the Brinqa Platform.
-
Click the Share button
 .
.The Share dashboard dialog appears. You have the following options:
-
Share with Brinqa Users: Click the dropdown and select the user(s) from the list of current Brinqa users to share the dashboard with. It also lists any users that have been granted access to the dashboard.
-
Share with Brinqa Roles: Click the dropdown and select the role(s) to share the dashboard with. It also lists any roles that have been granted access to the dashboard.
-
Access level: Click the dropdown next to each user or role and choose one of the following permissions:
-
View: View-only access. Users cannot modify or share the dashboard.
-
Edit: Users can modify the dashboard and share it with others.
-
Admin: Full access, including the ability to edit and share the dashboard, promote it, and change the dashboard layout.
-
-
Promote (optional): Click the Promote toggle next to a user or role to promote the dashboard to the main dashboard navigation for that user or role. Promoting means that a dashboard and the folder associated with it will be displayed on the Dashboards main page. For additional information on dashboard promoting, see Promote a dashboard.
-
-
Click Update access to save the changes.
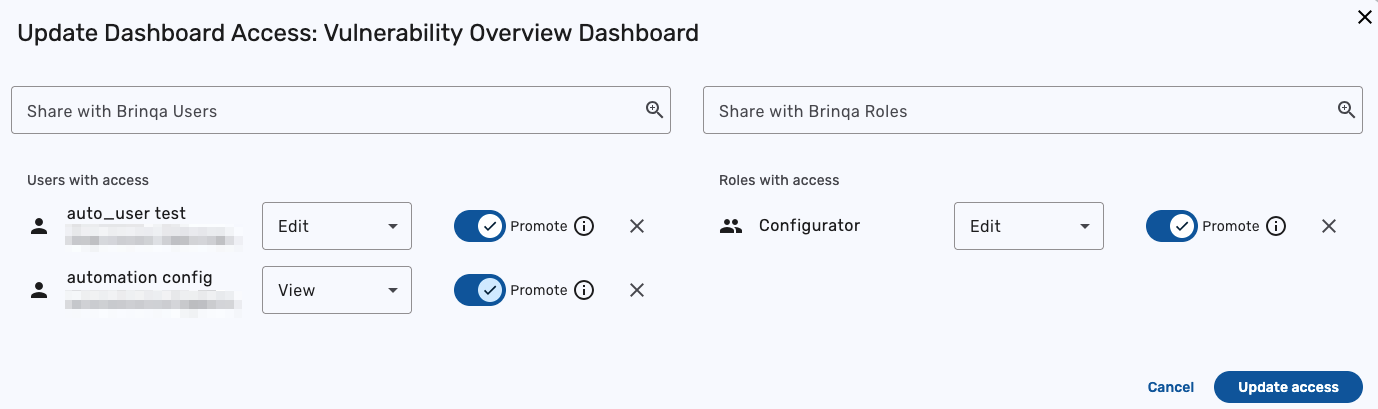
For examples, in the following screenshot, the "Vulnerability Overview Dashboard" has been shared with and promoted for two users and one role:
Upon the next login, the users or role(s) you have shared the dashboard with can view and/or modify the shared dashboard.
Edit or delete a dashboard
Users with the Configurator, Remediation owner, Risk owner,or System administrator role can edit or delete existing dashboards. To do so, follow these steps:
-
Navigate to Analytics > Dashboards.
-
Hold the pointer over the dashboard you want to delete and click the kebab (three vertical dots) menu, and click Delete.
Snapshot dashboards to PDF
Users with the Data exporter or System administrator role can snapshot dashboards to PDF. To snapshot a dashboard to PDF, follow these steps:
-
Navigate to Analytics > Dashboards.
-
Open the dashboard you want to snapshot and click Edit.
-
In the Setup tab, navigate to the Export settings section.
-
Configure the follow export settings as required:
-
Paper size: Click the dropdown and select the desired paper size. Options include: Letter, Legal, A5, A4, A3, A2, A1, or A0.
-
Page orientation: Click the dropdown and select how you want the dashboard to appear in the PDF. Options include: Portrait or Landscape.
-
Page header: Enter text to appear at the top of each PDF page.
-
Page footer: Enter text to appear at the bottom of each PDF page.
tipBy default, charts are not split across pages. If a chart does not fit on the current page, it is moved to the next page. Tables, however, can span across multiple pages, and column headers are repeated on each new page.
-
-
Click Update to save the snapshot settings.
-
Click the Snapshot to PDF
 icon.
icon. -
Click Snapshot now.
The PDF of the dashboard downloads to your local machine.
infoYou can also snapshot a dashboard directly from the Dashboards main page by clicking the Snapshot to PDF
icon. However, this method does not enable you to customize snapshot settings.