Remediation Owner Dashboards
This article details the Remediation owner dashboards, designed to provide remediation owners with a comprehensive overview of all the assets, findings, or tickets that they are responsible for remediating. The dashboards are composed of three main dashboards — Act, Monitor, and Comply - each offering insights for proactive measures and policy compliance to streamline and optimize the remediation process.
To access the Remediation owner dashboards, navigate to Dashboards, expand the left-hand side navigation menu, and then click one of the dashboards under the Remediation owner dropdown.
To see any data in the remediation owner dashboards, users must be associated with the finding or asset through the remediation owner cluster and have either the Risk analyst or Remediation owner role assigned to them. Access granted with the informed user cluster does not qualify for inclusion in these dashboards. Additionally, the data in the dashboards are updated following each successful completion of the data orchestration process.
Act dashboard
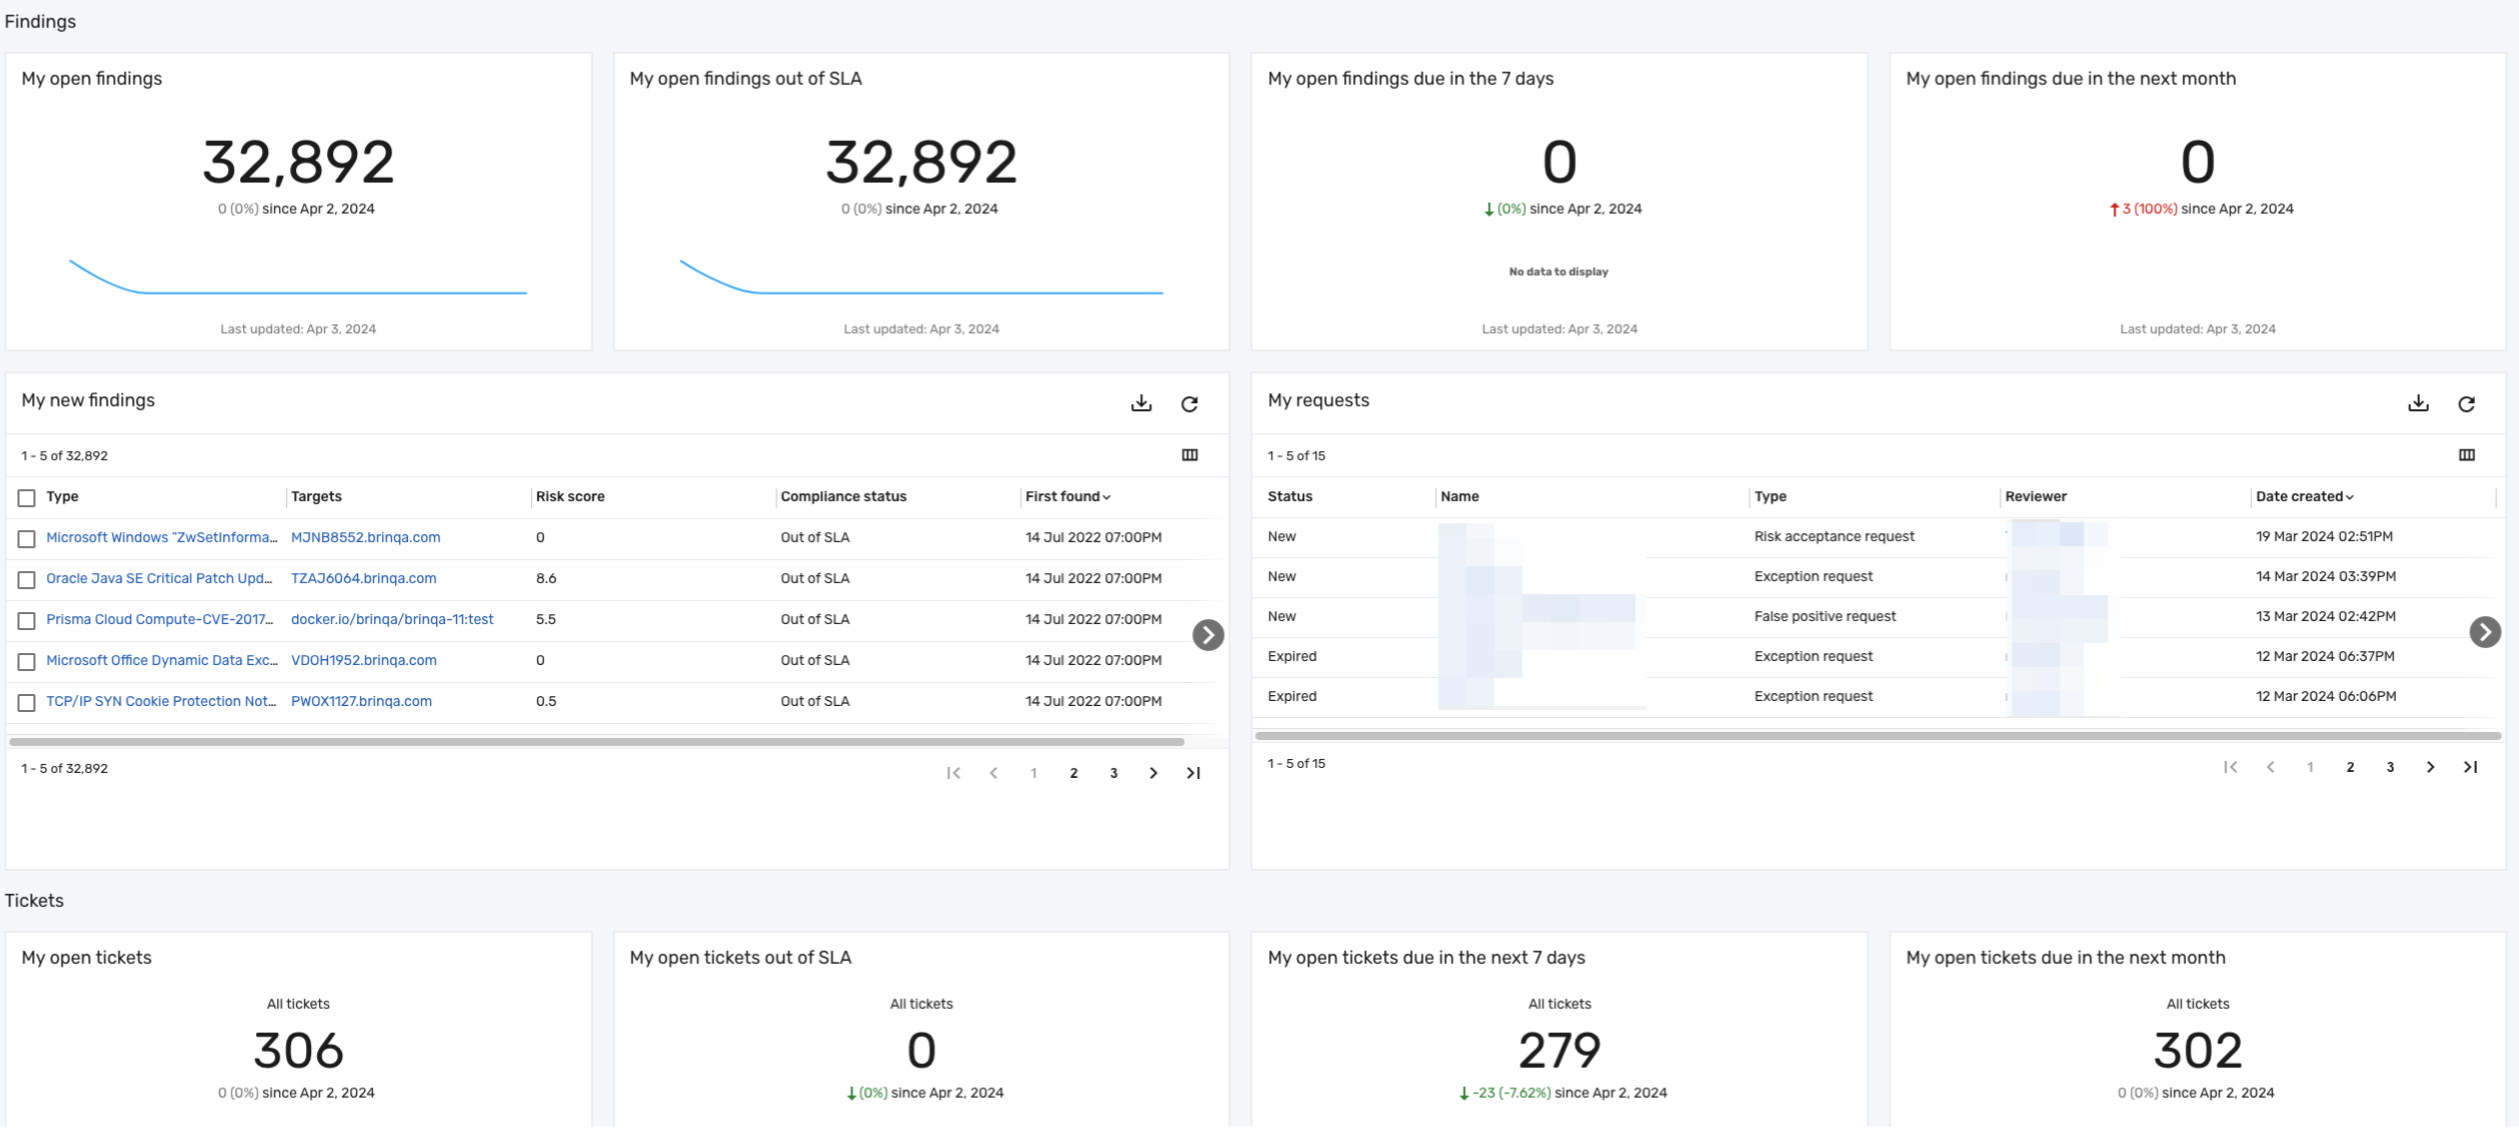
The Act dashboard highlights the most critical items that require immediate attention. This dashboard offers a comprehensive view of open and new findings, with an emphasis on those that are past due or nearing their service-level agreement (SLA) deadlines. Additionally, it includes requests and tickets related to the remediation owner, ensuring visibility into findings for which they are responsible. The following screenshot illustrates what your Act dashboard may look like:
Key features
The Act dashboard includes the following sections:
Findings: This section of the Act dashboard organizes findings assigned to the remediation owner, displaying open items, those requiring urgent action due to SLA deadlines, and findings due both in the immediate week and the upcoming month.
The Findings section contains a My new findings table that displays all new findings discovered in the last 7 days that the remediation owner is responsible for addressing:
Table 1: My new findings table
| Column | Description |
|---|---|
| Type | The type of the finding, indicating the specific nature or category of the security issue identified. This can range from issues related to web application security to concerns about error handling. These types help in categorizing the findings to better understand the area of vulnerability or non-compliance. |
| Targets | The application, container, site, or subdomain that the finding is impacting. |
| Risk score | The risk score of the finding on a scale of 0-10. |
| Compliance status | The compliance status of the finding. Compliance statuses include Met SLA, Out of SLA, or Within SLA. |
| First found | The date on which the finding was first discovered. |
The Findings section also contains a My requests table that displays requests related to findings that the remediation owner is responsible for addressing:
Table 2: My requests table
| Column | Description |
|---|---|
| Status | The status of the request. Statuses include active, false positive, fixed, reopened, risk accepted, or risk temporarily accepted. |
| Name | The name of the request. You can click the name to view the details of the request. |
| Type | The type of request. Types include exception requests, false positive requests, or risk acceptance requests. |
| Reviewer | The name of the individual responsible for reviewing and acting on the request. |
| Date Created | The date on which the request was created. |
Tickets: This section of the Act dashboard showcases tickets that contain findings for which the remediation owner is responsible. It highlights open tickets, especially those urgently requiring attention. Additionally, the dashboard displays tickets due in the next 7 days and in the upcoming month, with these due dates representing the last time the data supporting the visualizations were updated, which may differ from today's date.
The Tickets section also contains a My new tickets table that displays tickets containing findings the remediation owner needs to address, regardless of whether the tickets are directly assigned to them:
Table 3: My new tickets table
| Column | Description |
|---|---|
| Status | The current status of the ticket. Statuses include backlog, closed, in progress, open, or to-do. |
| Name | The name of the ticket. |
| External UIDs | The identifier for the ticket in an external system, such as a Jira ticket ID, visible when the ticket is pushed to an external system. |
| Progress | The proportion of findings within the ticket that have been addressed, determining the ticket's progress towards resolution. The progress is measured on a scale from 0-100 and is illustrated on a linear gauge. |
| Risk score | The risk score associated with the ticket. |
| Compliance status | The compliance status of the ticket in relation to compliance requirements and standards. Compliance statuses include Met SLA, Out of SLA, or Within SLA. |
| Date created | The date on which the ticket was initially created. |
| Date closed | The date on which the ticket was resolved or closed. |
| Due date | The deadline for the ticket to be addressed or resolved. |
Comply dashboard
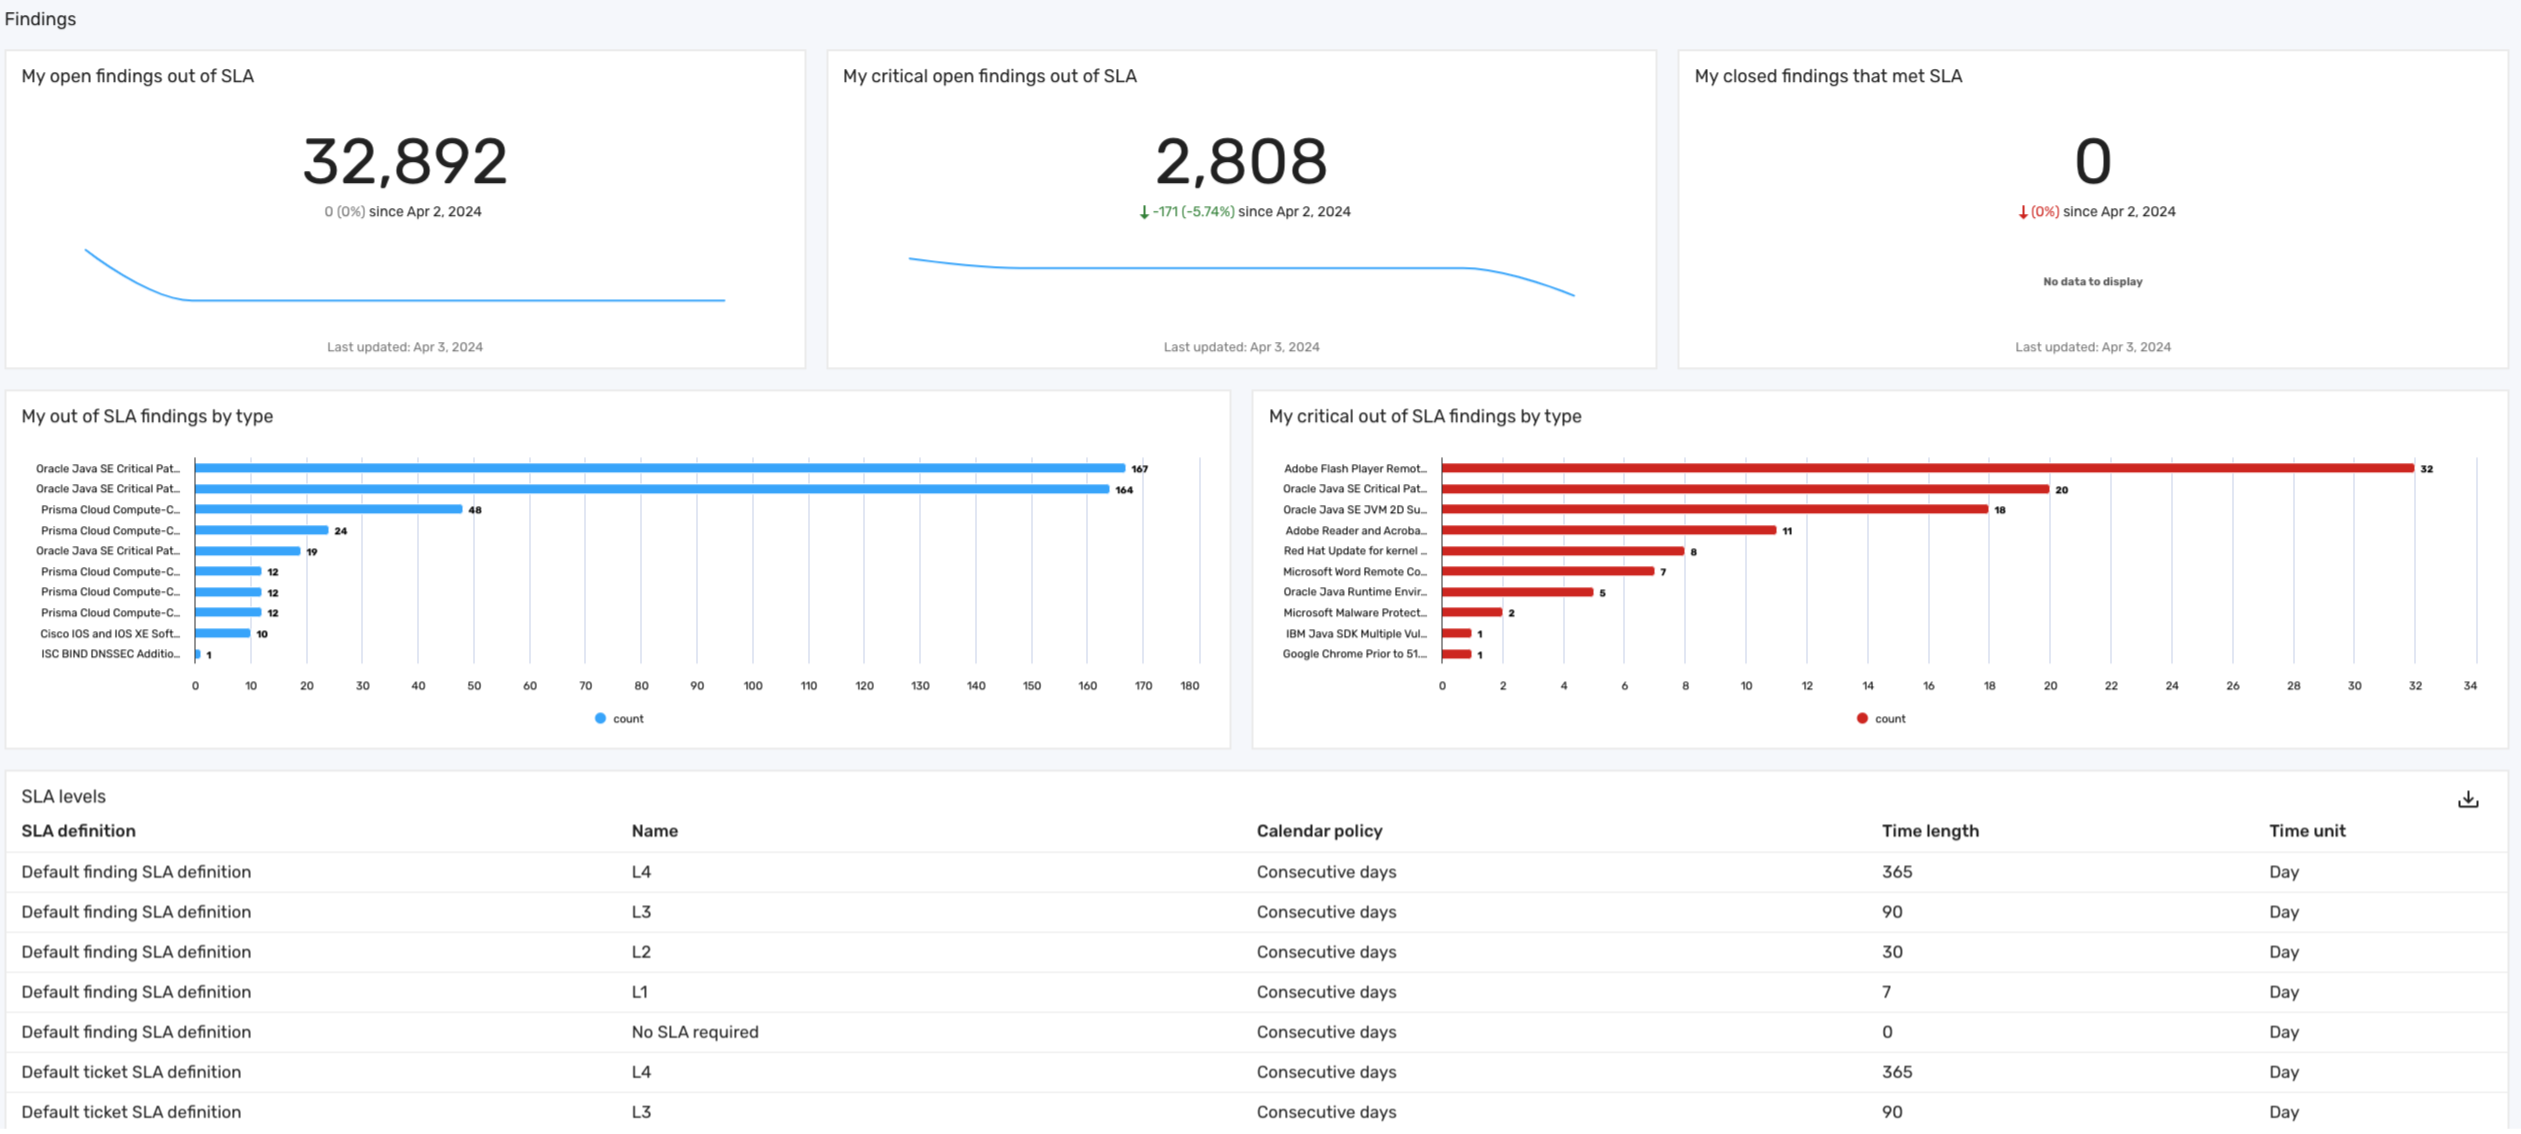
The Comply dashboard provides remediation owners with insights into their performance in adhering to SLA deadlines and the nature of their assigned findings that could be causing issues in meeting those deadlines. The following screenshot illustrates what your Comply dashboard may look like:
Key features
Key features of this section include:
-
My open findings out of SLA: Highlights all open findings that have not met their SLA deadlines.
-
My critical open findings out of SLA: Focuses on critical findings that are out of SLA. This allows remediation owners to identify and prioritize the most severe issues that require immediate attention.
-
My closed findings that met SLA: Displays the findings that were successfully closed within their SLA timelines, offering insights into the effectiveness and efficiency of the remediation process.
-
My out of SLA Findings by type: Categorizes all findings that are out of SLA by their specific type, enabling remediation owners to understand the potentially common types of delayed findings.
-
My critical out of SLA Findings by type: Categorizes critical findings that are out of SLA by type, helping remediation owners prioritize areas that may require immediate action.
This section also includes a table that provides an overview of the different default SLA levels for findings and tickets, along with the allotted days for fixing issues corresponding to each level:
Table 4: SLA levels
| Column | Description |
|---|---|
| SLA definition | The name of the SLA definition. |
| Name | The service level defined by the SLA. While default levels such as L1, L2, L3, and L4 are provided as examples, you can configure these levels according to the needs of your organization. |
| Calendar policy | The days in which the SLA is measured, either Consecutive days or Business days. Business days include Monday through Friday. |
| Time length | The amount of time, in days, before the findings or tickets are considered out of SLA. |
| Time unit | The time unit for the service level. |
Monitor dashboard
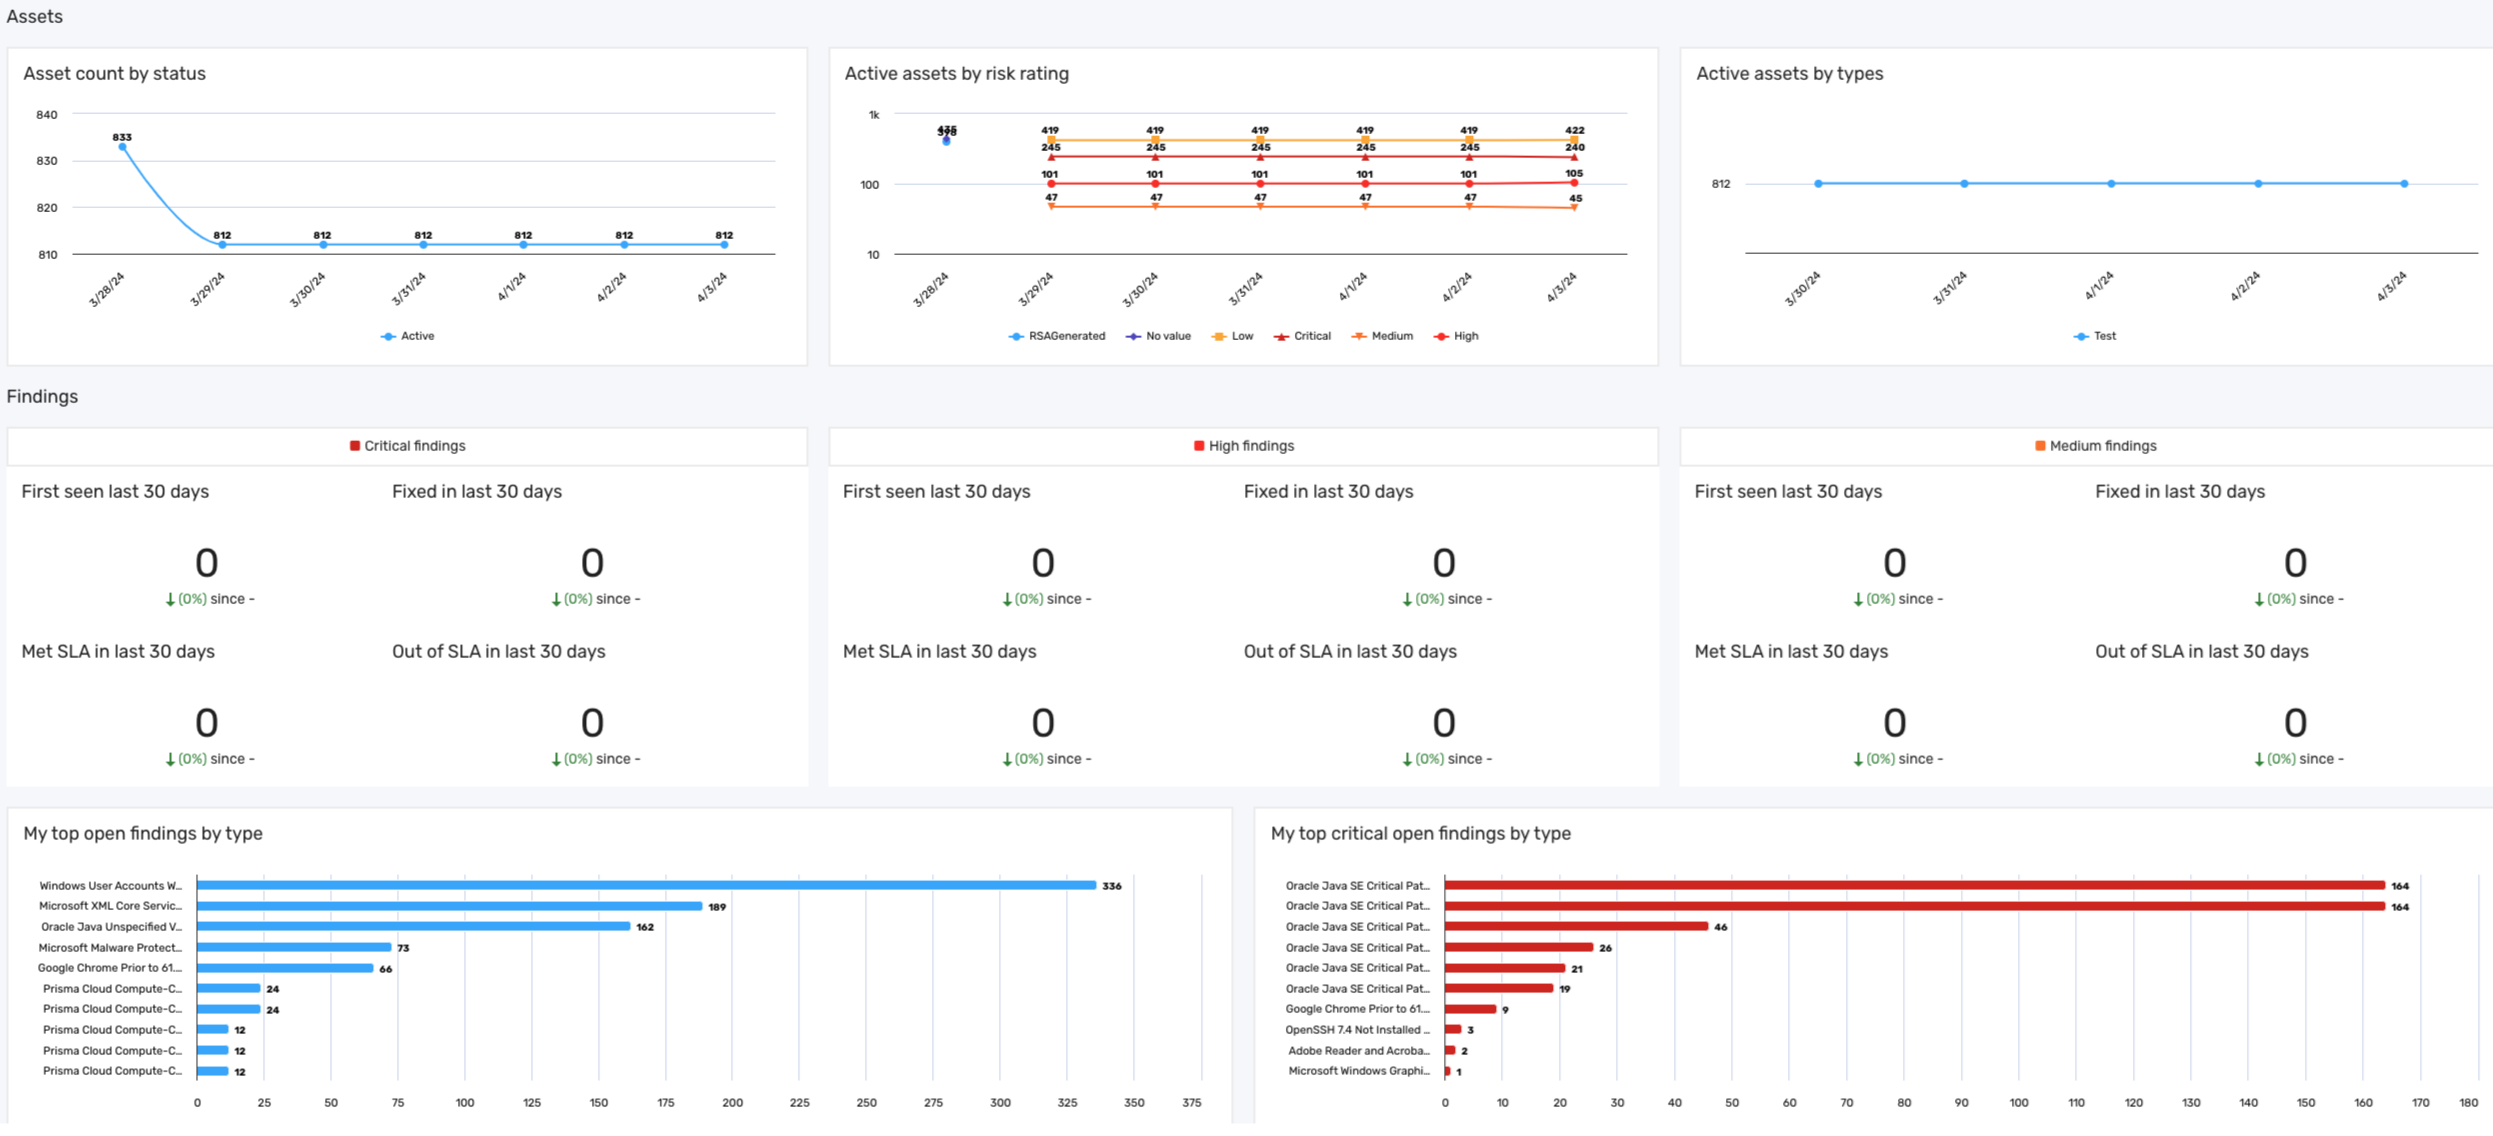
The Monitor dashboard is designed as an informational tool for remediation owners to track and understand their responsibilities and activities over time. This dashboard provides a broad view to observe trends and changes in your assigned assets, findings, tickets, and requests. The following screenshot illustrates what your Monitor dashboard may look like:
Key features
The Monitor dashboard includes the following sections:
-
Assets: This section of the Monitor dashboard organizes the assets that the remediation owner has visibility into, including assets that may not have current findings. It displays the total assets by status (active or inactive), active assets by risk rating (low, medium, high, or critical), and active assets by technology type, such as laptops, servers, phones, or tablets.
-
Findings: This section of the Monitor dashboard organizes findings assigned to the remediation owner by various criteria. It categorizes findings based on severity levels and SLA deadlines, and tracks findings first seen or resolved in the last 30 days. It also presents a comparative view of open and closed findings over time, as well as a breakdown of open findings by their types.
infoThe types of findings are the data models that extend Finding. These types include alerts, dynamic code findings, manual findings, open source findings, pentest findings, static code findings, violations, and vulnerabilities.
-
Tickets: This section of the Monitor dashboard provides a comprehensive view of tickets related to the findings the remediation owner is responsible for addressing. It encompasses a range of metrics to effectively track and monitor tickets, including:
-
Ticket by status category: Displays the current status of the tickets, categorizing them as either open or closed, giving a quick snapshot of ongoing versus completed tasks.
-
Open tickets by compliance status: Highlights open tickets containing findings assigned to the remediation owner, specifically focusing on their compliance status, such as Within SLA or Met SLA. This can help remediation owners adhere to their organization's established service-level agreements.
-
Open tickets by type: Categorizes ticket counts by types, such as vulnerability tickets, violation tickets, or pentest tickets. This breakdown can help remediation owners understand the nature and variety of issues being managed.
-
-
Requests: This section of the Monitor dashboard organizes the requests containing findings assigned to the remediation owner and their related findings. Key features of this section include:
-
Requests by status: Tracks requests by their current status over time, helping remediation owners visualize and identify trends or spikes in request activities.
-
Findings with approved request status by risk rating: Displays a count of findings in approved requests, segmented by their risk ratings. This information can help remediation owners understand the volume and severity of findings affected by approvals.
-
Open findings by request status: Presents a count of open findings over time that are currently associated with requests, categorized by the status of these requests, such as Approved, Expired, In Review, New, or Rejected. This can help the remediation owner gauge the pending requests and their implications on open findings.
-